Stat-Ease Blog

Categories
Hear Ye, Hear Ye: A Response Surface Method (RSM) Experiment on Sound Produces Surprising Results
A few years ago, while evaluating our training facility in Minneapolis, I came up with a fun experiment that demonstrates a great application of RSM for process optimization. It involves how sound travels to our students as a function of where they sit. The inspiration for this experiment came from a presentation by Tom Burns of Starkey Labs to our 5th European DOE User Meeting. As I reported in our September 2014 Stat-Teaser, Tom put RSM to good use for optimizing hearing aids.
Background
Classroom acoustics affect speech intelligibility and thus the quality of education. The sound intensity from a point source decays rapidly by distance according to the inverse square law. However, reflections and reverberations create variations by location for each student—some good (e.g., the Whispering Gallery at Chicago Museum of Science and Industry—a very delightful place to visit, preferably with young people in tow), but for others bad (e.g., echoing). Furthermore, it can be expected to change quite a bit from being empty versus fully occupied. (Our then-IT guy Mike, who moonlights as a sound-system tech, called these—the audience, that is—“meat baffles”.)
Sound is measured on a logarithmic scale called “decibels” (dB). The dBA adjusts for varying sensitivities of the human ear.
Frequency is another aspect of sound that must be taken into account for acoustics. According to Wikipedia, the typical adult male speaks at a fundamental frequency from 85 to 180 Hz. The range for a typical adult female is from 165 to 255 Hz.
Procedure

Stat-Ease training room at one of our old headquarters—sound test points spotted by yellow cups.
This experiment sampled sound on a 3x3 grid from left to right (L-R, coded -1 to +1) and front to back (F-B, -1 to +1)—see a picture of the training room above for location—according to a randomized RSM test plan. A quadratic model was fitted to the data, with its predictions then mapped to provide a picture of how sound travels in the classroom. The goal was to provide acoustics that deliver just enough loudness to those at the back without blasting the students sitting up front.
Using sticky notes as markers (labeled by coordinates), I laid out the grid in the Stat-Ease training room across the first 3 double-wide-table rows (4th row excluded) in two blocks:
- 2² factorial (square perimeter points) with 2 center points (CPs).
- Remainder of the 32 design (mid-points of edges) with 2 additional CPs.
I generated sound from the Online Tone Generator at 170 hertz—a frequency chosen to simulate voice at the overlap of male (lower) vs female ranges. Other settings were left at their defaults: mid-volume, sine wave. The sound was amplified by twin Dell 6-watt Harman-Kardon multimedia speakers, circa 1990s. They do not build them like this anymore 😉 These speakers reside on a counter up front—spaced about a foot apart. I measured sound intensity on the dBA scale with a GoerTek Digital Mini Sound Pressure Level Meter (~$18 via Amazon).
Results
I generated my experiment via the Response Surface tab in Design-Expert® software (this 3³ design shows up under "Miscellaneous" as Type "3-level factorial"). Via various manipulations of the layout (not too difficult), I divided the runs into the two blocks, within which I re-randomized the order. See the results tabulated below.
| Block | Run | Space Type | Coordinate (A: L-R) | Coordinate (B: F-B) | Sound (dBA) |
|---|---|---|---|---|---|
| 1 | 1 | Factorial | -1 | 1 | 70 |
| 1 | 2 | Center | 0 | 0 | 58 |
| 1 | 3 | Factorial | 1 | -1 | 73.3 |
| 1 | 4 | Factorial | 1 | 1 | 62 |
| 1 | 5 | Center | 0 | 0 | 58.3 |
| 1 | 6 | Factorial | -1 | -1 | 71.4 |
| 1 | 7 | Center | 0 | 0 | 58 |
| 2 | 8 | CentEdge | -1 | 0 | 64.5 |
| 2 | 9 | Center | 0 | 0 | 58.2 |
| 2 | 10 | CentEdge | 0 | 1 | 61.8 |
| 2 | 11 | CentEdge | 0 | -1 | 69.6 |
| 2 | 12 | Center | 0 | 0 | 57.5 |
| 2 | 13 | CentEdge | 1 | 0 | 60.5 |
Notice that the readings at the center are consistently lower than around the edge of the three-table space. So, not surprisingly, the factorial model based on block 1 exhibits significant curvature (p<0.0001). That leads to making use of the second block of runs to fill out the RSM design in order to fit the quadratic model. I was hoping things would play out like this to provide a teaching point in our DOESH class—the value of an iterative strategy of experimentation.
The 3D surface graph shown below illustrates the unexpected dampening (cancelling?) of sound at the middle of our Stat-Ease training room.
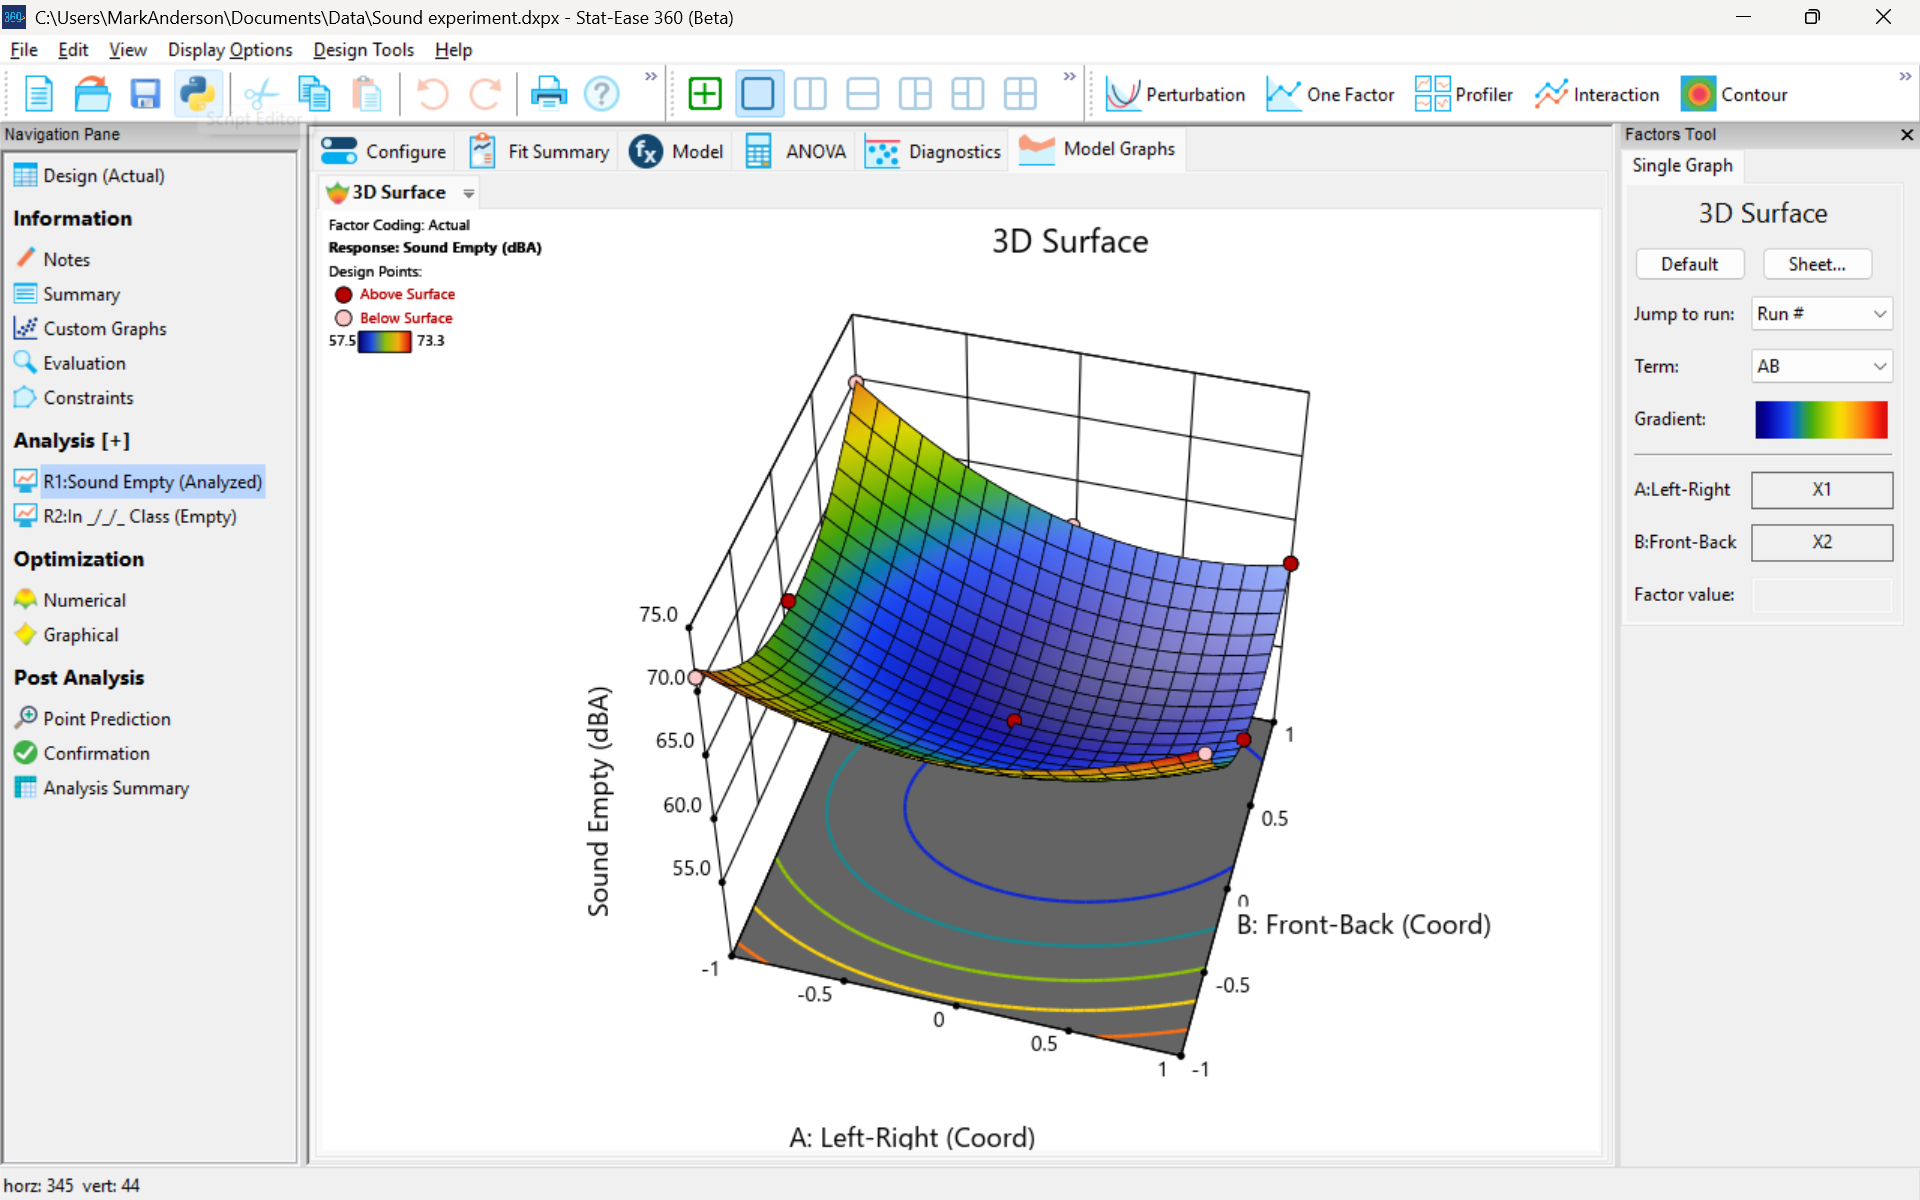
3D surface graph of sound by classroom coordinate.
Perhaps this sound ‘map’ is typical of most classrooms. I suppose that it could be counteracted by putting acoustic reflectors overhead. However, the minimum loudness of 57.4 (found via numeric optimization and flagged over the surface pictured) is very audible by my reckoning (having sat in that position when measuring the dBA). It falls within the green zone for OSHA’s decibel scale, as does the maximum of 73.6 dBA, so all is good.
What next
The results documented here came from an empty classroom. I would like to do it again with students (aka meat baffles) present. I wonder how that will affect the sound map. Of course, many other factors could be tested. For example, Rachel from our Front Office team suggested I try elevating the speakers. Another issue is the frequency of sound emitted. Furthermore, the oscillation can be varied—sine, square, triangle and sawtooth waves could be tried. Other types of speakers would surely make a big difference.
What else can you think of to experiment on for sound measurement? Let me know.
Like the blog? Never miss a post - sign up for our blog post mailing list.
Tips and tools for modeling counts most precisely
In a previous Stat-Ease blog, my colleague Shari Kraber provided insights into Improving Your Predictive Model via a Response Transformation. She highlighted the most commonly used transformation: the log. As a follow up to this article, let’s delve into another transformation: the square root, which deals nicely with count data such as imperfections. Counts follow the Poisson distribution, where the standard deviation is a function of the mean. This is not normal, which can invalidate ordinary-least-square (OLS) regression analysis. An alternative modeling tool, called Poisson regression (PR) provides a more precise way to deal with count data. However, to keep it simple statistically (KISS), I prefer the better-known methods of OLS with application of the square root transformation as a work-around.
When Stat-Ease software first introduced PR, I gave it a go via a design of experiment (DOE) on making microwave popcorn. In prior DOEs on this tasty treat I worked at reducing the weight of off-putting unpopped kernels (UPKs). However, I became a victim of my own success by reducing UPKs to a point where my kitchen scale could not provide adequate precision.
With the tools of PR in hand, I shifted my focus to a count of the UPKs to test out a new cell-phone app called Popcorn Expert. It listens to the “pops” and via the “latest machine learning achievements” signals users to turn off their microwave at the ideal moment that maximizes yield before they burn their snack. I set up a DOE to compare this app against two optional popcorn settings on my General Electric Spacemaker™ microwave: standard (“GE”) and extended (“GE++”). As an additional factor, I looked at preheating the microwave with a glass of water for 1 minute—widely publicized on the internet to be the secret to success.
Table 1 lays out my results from a replicated full factorial of the six combinations done in random order (shown in parentheses). Due to a few mistakes following the software’s plan (oops!), I added a few more runs along the way, increasing the number from 12 to 14. All of the popcorn produced tasted great, but as you can see, the yield varied severalfold.
| A: | B: | UPKs | ||
|---|---|---|---|---|
| Preheat | Timing | Rep 1 | Rep 2 | Rep 3 |
| No | GE | 41 (2) | 92 (4) | |
| No | GE++ | 23 (6) | 32 (12) | 34 (13) |
| No | App | 28 (1) | 50 (8) | 43 (11) |
| Yes | GE | 70 (5) | 62 (14) | |
| Yes | GE++ | 35 (7) | 51 (10) | |
| Yes | App | 50 (3) | 40 (9) |
I then analyzed the results via OLS with and without a square root transformation, and then advanced to the more sophisticated Poisson regression. In this case, PR prevailed: It revealed an interaction, displayed in Figure 1, that did not emerge from the OLS models.

Figure 1: Interaction of the two factors—preheat and timing method
Going to the extended popcorn timing (GE++) on my Spacemaker makes time-wasting preheating unnecessary—actually producing a significant reduction in UPKs. Good to know!
By the way, the app worked very well, but my results showed that I do not need my cell phone to maximize the yield of tasty popcorn.
To succeed in experiments on counts, they must be:
- discrete whole numbers with no upper bound
- kept with within over a fixed area of opportunity
- not be zero very often—avoid this by setting your area of opportunity (sample size) large enough to gather 20 counts or more per run on average.
For more details on the various approaches I’ve outlined above, view my presentation on Making the Most from Measuring Counts at the Stat-Ease YouTube Channel.
Wrap-Up: Thanks for a great 2022 Online DOE Summit!
Thank you to our presenters and all the attendees who showed up to our 2022 Online DOE Summit! We're proud to host this annual, premier DOE conference to help connect practitioners of design of experiments and spread best practices & tips throughout the global research community. Nearly 300 scientists from around the world were able to make it to the live sessions, and many more will be able to view the recordings on the Stat-Ease YouTube channel in the coming months.
Due to a scheduling conflict, we had to move Martin Bezener's talk on "The Latest and Greatest in Design-Expert and Stat-Ease 360." This presentation will provide a briefing on the major innovations now available with our advanced software product, Stat-Ease 360, and a bit of what's in store for the future. Attend the whole talk to be entered into a drawing for a free copy of the book DOE Simplified: Practical Tools for Effective Experimentation, 3rd Edition. New date and time: Wednesday, October 12, 2022 at 10 am US Central time.
Even if you registered for the Summit already, you'll need to register for the new time on October 12. Click this link to head to the registration page. If you are not able to attend the live session, go to the Stat-Ease YouTube channel for the recording.

Want to be notified about our upcoming live webinars throughout the year, or about other educational opportunities? Think you'll be ready to speak on your own DOE experiences next year? Sign up for our mailing list! We send emails every month to let you know what's happening at Stat-Ease. If you just want the highlights, sign up for the DOE FAQ Alert to receive a newsletter from Engineering Consultant Mark Anderson every other month.
Thank you again for helping to make the 2022 Online DOE Summit a huge success, and we'll see you again in 2023!
Magic of multifactor testing revealed by fun physics experiment
If you haven't discovered Mark Anderson's Stats Made Easy blog yet, check it out! Mark offers a wry look at all things statistical and/or scientific from an engineering perspective. You will find posts on topics as varied as nature, science, sports, politics, and DOE. His latest post, Magic of multifactor testing, involves a fun DOE with bouncy balls.
The first article follows the setup of Mark's DOE. At the bottom of Part 1, click on the Related Links tab to find Part 2 (Results) and Part 3 (Data and Details)
State Fair Bread — through SCIENCE!
Hello, Design-Expert® software users, Stat-Ease clients and statistics fans! I’m Rachel, the Client Specialist [ed. 2024: now I'm the Market Development Manager] here at Stat-Ease. If you’ve ever called our general line, I’m probably the one who picked up; I’m the one who prints and binds your workshop materials when you take our courses. I am not, by any stretch of the imagination, a statistician. So why am I, a basic office administrator who hasn’t taken a math class since high school, writing a blog post for Stat-Ease? It’s because I entered this year’s Minnesota State Fair Creative Activities Contest thanks to Design-Expert and help from the Stat-Ease consultant team.

I’m what you’d call a subject matter expert when it comes to baking challah bread. Challah is a Jewish bread served on Shabbat, typically braided, and made differently depending if you’re of Ashkenazi or Sephardi heritage. I started making challah with my mom when I was 8 years old (Ashkenazi style), and have been making it regularly since I left home for college. As I developed my own cooking and baking styles, I began to feel like my mother’s recipe had gotten a bit stale. So I’ve started to add things to the dough — just a little vanilla extract at first, then a dash of almond extract, then a batch with cinnamon and raisins, another one with chocolate chips, a Rosh Hashanah version that swaps honey for sugar and includes apple bits (we eat apples and honey for a sweet New Year), even one batch with red food coloring and strawberry bits for a breast cancer awareness campaign. None of these additions were tested in a terribly scientific way; I’m a baker, not a lab chemist. So when I decided I wanted to enter the State Fair with my challah this year, I got to wondering: what is actually the best way to make this challah? And lucky me, I’m employed at the best place in the world to find out.
I brought up the idea of running a designed experiment on my bread with my supervisor, and one of our statisticians, Brooks Henderson, was assigned to me as my “consultant” on the project. Before designing the experiment, we first needed to narrow down the factors we wanted to test and the results we wanted to measure. I set a hard line on not changing any of my mother’s original recipe — I know what Mom’s challah tastes like, I know it’s good, and I don’t want to mess with the complex chemistry involved in baking. We settled on adjusting the amount of vanilla and almond extracts I add to the dough, and since the Fair required me to submit a smaller loaf than Mom’s recipe makes, we tested the time and temperature required to bake. For our results, we asked our coworkers to judge 7 attributes of the bread, including taste, texture, and overall appeal. A statistician and I judged the color of each loaf and measured the thickness of the crust.
It sounds so simple, right? That’s what I thought: plug the factors into Design-Expert, let it work its magic, and poof! the best bread recipe. But that just shows you how little I know! If you’re a formulator, or you’ve taken our Mixture Design for Optimal Formulations workshop, you know what the first hurdle was: even though we only changed two ingredients, we were still dealing with a combined mixture/process design. Since mixture designs work with ratios of ingredients as opposed to independent amounts, adding 5g of vanilla extract and 3g of almond extract is a different ratio within the dough, and therefore a different mixture, than adding 2g of vanilla and 6g of almond. To make this work, the base recipe had to become a third part of the mixture. Consultant Wayne Adams stepped in at that point to help us design the experiment. He and Brooks built a mixture/numeric combined design that specified proportions of the 3 ingredients (base recipe, vanilla, and almond), along with the time and temperature settings.

Our second major problem was the time constraint. I brought up the idea for this bread experiment on July 18, and I had to bring my loaves to the fairgrounds on the morning of August 20. We wanted our coworkers to taste this bread, and I had a required family vacation to attend that first week of August. When we accounted for that, along with the time it took to design the experiment, we were left with just 14 days of tasting. At a rate of 2 loaves per weeknight, 4 per weekend, and at the cost of my social life, our maximum budget allowed for a design with only 26 runs. I’m sure there are some of you reading this and wondering how on earth I’d get any meaningful model out of a paltry 26 runs. Well, you’ve got reason to: we just barely got information I could use. Brooks ran through a number of different designs before he got one with even halfway decent power, and we also had to accept that, if there were any curvature to the results, we would not be able to model it with much certainty. Our final design had just two center points to find any curvature related to time or temperature, with no budgeted time for follow-up. Since our working hypothesis was that we’d see a linear relationship between time and temperature, not a quadratic one, the center points were to check this assumption and ensure it was correct. We got a working model, yes, but we took a big risk — and the fact that I didn’t even place in the top 5 entries only underlines that.
On top of all these constraints? I’m only human, and as you well know, human operators make mistakes. My process notes are littered with “I messed up and…” Example: the time I stacked my lunchbox on top of a softer loaf of challah in my bicycle bag for the half-hour ride to work. I’ll give you three guesses how that one rated on “uniformity” and “symmetry,” and your first two don’t count. If we had more time, we could have added more runs and gotten data that didn’t have that extra variability, but the fair submission date was my hard deadline. Mark Anderson, a Stat-Ease principal, tells me this is a common issue in many industries. When there is a “real-time rush to improve a product,” it may not be the best science to accept flawed data, but you make do and account for variations as best you can.
During the analysis, we used the Autoselect tool in Design-Expert to determine which factors had significant effects on the responses (mostly starting with the 2FI model). Another statistician here at Stat-Ease, Martin Bezener, just presented a webinar about this incredible tool — visit our web site to view a recording and learn more about it. When all of our tasters’ ratings were averaged together, we got significant models for Aroma, Appeal, Texture, Overall Taste, Color, and Crust Thickness, with Adj. R² values above 0.8 in most cases. This means that our models captured 80% of the variation in the data, with about 20% unexplained variation (noise) leftover. In general, the time and temperature effects seem to be the most important — we didn’t learn much about the two extracts. Almond only showed up as an effect (and a minor one at that) in one model for the aroma response, and vanilla didn’t show up at at all!
The other thing that surprised me was that I expected to be able to block this experiment. Blocking is a technique covered in our Modern DOE for Process Optimization workshop by which it’s possible to account for variation between any impossible-to-change source of variation, such as personal differences between tasters. However, since our tasters weren’t always present at every tasting and because we had so few runs in the experiment, we had too few degrees of freedom to block the results and still get a powerful model. It turned out that blocking wouldn’t have shown us much. We looked at a few individual tasters’ results individually, and that didn’t seem to illuminate anything different from what we saw before — which tells us that blocking the whole experiment wouldn’t have uncovered anything new, either.
In the end, I’m happy with our kludged-together experiment. I got a lot of practice baking, and determined the best process for my bread. If we were to do this again, I’d want to start in April to train my tasters better, determine appropriate amounts of other additions like chocolate chips, and really delve into ingredient proportions in a proper mixture design. And of course, I couldn’t have done any of this without the Stat-Ease consulting team. If you have questions on how our consultants can help design and analyze your experiments, send us an email.