Make breakthrough improvements to your product and process with Stat-Ease 360. This "pro" version augments Design-Expert software with commanding features for advanced users. Capitalizing on the same streamlined workflow that makes Design-Expert best-in-class for design of experiments, technical professionals who are running computer experiments or want to implement Python scripting can now take advantage of all new functionality. Space-filling designs, Gaussian process models, Python scripting, and a new logistic classification node make Stat-Ease 360 a more powerful version of Design-Expert!
Stat-Ease 360 makes it incredibly easy to apply powerful multifactor testing tools. Give it a try to see what it can do for accelerating your research and making it a huge success. Download the Stat-Ease 360 feature sheet.
Looking for Design-Expert software? Click here!
View License Options Free Trial Request Demo for Your Team

Design-Expert makes it easy to see what, if anything, emerges as statistically significant and how to model the results most precisely. It provides the confidence you need to present and, perhaps, publish your findings. Don’t take our word for it, test it out with one or more of the data sets that come with the software.
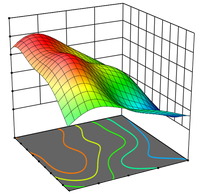
Build and analyze designs for deterministic responses (such as those from computer experiments) or standard, "noisy" experiments with Gaussian process models. Improved diagnostic & design options make it easy to tell your data's unique story.

Create Python scripts that interact with Stat-Ease 360. Make use of the entire Python ecosystem to visualize, analyze, and make the most of your data. Use included libraries or write your own tools that do exactly what you need, with the backing of Stat-Ease's powerful statistical engine.

Watch the Stat-Ease 360 launch webinar: The Debut of Stat-Ease 360 presented by Martin Bezener, Stat-Ease President & CTO.
Watch Python Integration with Stat-Ease 360 presented by Hank Anderson, Vice-President of Software Development.
More on-demand videos available on the Stat-Ease YouTube Channel.
A Python script that can perform lifetime analysis with a Weibull fit is available in the Script dialog, along with other helpful tools. Perform Weibull regressions on lifetime data using a Python graphical user interface (GUI), then use numerical optimization tools to maximize the lifetime of your products.
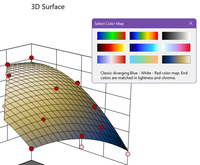
Choose from nine vivid color gradients (including a linear map for colorblind visibility) that remove false anomalies and improve areas of low contrast. Pick the best one for your project to show off the highs, lows, and curvature in your model & optimization graphs.
Import and analyze designs with both very-hard-to-change and hard-to-change factors for additional specificity in your system. For teams that handle variables that are difficult or time-consuming to randomize, split-plot and split-split-plot designs allow you to take your unique business needs into account while still harnessing the power of DOE.
If you have a team that would like an introduction to design of experiments (DOE) and Design-Expert software, our experts will customize a 1-hr demonstration for you.
If you are a University student or professor and would like information on academic licensing options, please click on the Academic Licensing button.
Request a Demo Academic Licensing