Stat-Ease Blog

Categories
Understanding Lack of Fit: When to Worry
An analysis of variance (ANOVA) is often accompanied by a model-validation statistic called a lack of fit (LOF) test. A statistically significant LOF test often worries experimenters because it indicates that the model does not fit the data well. This article will provide experimenters a better understanding of this statistic and what could cause it to be significant.
The LOF formula is:

where MS = Mean Square. The numerator (“Lack of fit”) in this equation is the variation between the actual measurements and the values predicted by the model. The denominator (“Pure Error”) is the variation among any replicates. The variation between the replicates should be an estimate of the normal process variation of the system. Significant lack of fit means that the variation of the design points about their predicted values is much larger than the variation of the replicates about their mean values. Either the model doesn't predict well, or the runs replicate so well that their variance is small, or some combination of the two.
Case 1: The model doesn’t predict well
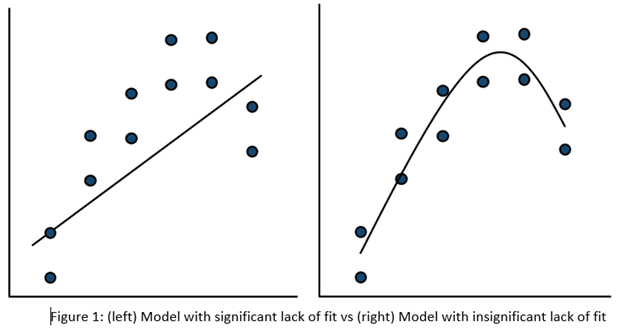
On the left side of Figure 1, a linear model is fit to the given set of points. Since the variation between the actual data and the fitted model is very large, this is likely going to result in a significant LOF test. The linear model is not a good fit to this set of data. On the right side, a quadratic model is now fit to the points and is likely to result in a non-significant LOF test. One potential solution to a significant lack of fit test is to fit a higher-order model.
Case 2: The replicates have unusually low variability
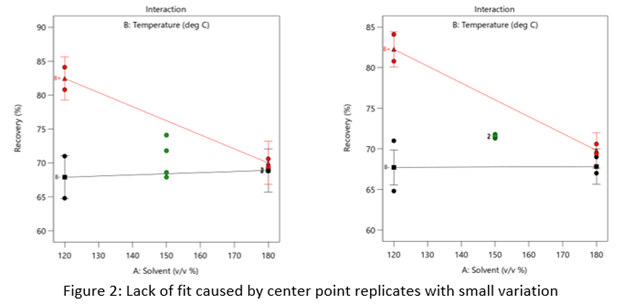
Figure 2 (left) is an illustration of a data set that had a statistically significant factorial model, including some center points with variation that is similar to the variation between other design points and their predictions. Figure 2 (right) is the same data set with the center points having extremely small variation. They are so close together that they overlap. Although the predicted factorial model fits the model points well (providing the significant model fit), the differences between the actual data points are substantially greater than the differences between the center points. This is what triggers the significant LOF statistic. The center points are fitting better than the model points. Does this significant LOF require us to declare the model unusable? That remains to be seen as discussed below.
When there is significant lack of fit, check how the replicates were run— were they independent process conditions run from scratch, or were they simply replicated measurements on a single setup of that condition? Replicates that come from independent setups of the process are likely to contain more of the natural process variation. Look at the response measurements from the replicates and ask yourself if this amount of variation is similar to what you would normally expect from the process. If the “replicates" were run more like repeated measurements, it is likely that the pure error has been underestimated (making the LOF denominator artificially small). In this case, the lack of fit statistic is no longer a valid test and decisions about using the model will have to be made based on other statistical criteria.
If the replicates have been run correctly, then the significant LOF indicates that perhaps the model is not fitting all the design points well. Consider transformations (check the Box Cox diagnostic plot). Check for outliers. It may be that a higher-order model would fit the data better. In that case, the design probably needs to be augmented with more runs to estimate the additional terms.
If nothing can be done to improve the fit of the model, it may be necessary to use the model as is and then rely on confirmation runs to validate the experimental results. In this case, be alert to the possibility that the model may not be a very good predictor of the process in specific areas of the design space.
Background on the KCV Designs
Design-Expert® software, v12 offers formulators a simplified modeling option crafted to maximize essential mixture-process interaction information, while minimizing experimental costs. This new tool is nicknamed a “KCV model” after the initials of the developers – Scott Kowalski, John Cornell, and Geoff Vining. Below, Geoff reminisces on the development of these models.
To help learn this innovative methodology, first view a recorded webinar on the subject.
Next, sign up for the workshop "Mixture Design for Optimal Formulations".
The origin of the KCV designs goes back to a mixtures short-course that I taught for Doug Montgomery at an adhesives company in Ohio. One of the topics was mixture-process variables experiments, and Doug's notes for the course contained an example using ratios of mixture proportions with the process variables. Looking at the resulting designs, I recognized that ratios did not cover the mixture design space well. Scott Kowalski was beginning his dissertation at the time. Suddenly, he had a new chapter (actually two new chapters)!
The basic idea underlying the KCV designs is to start with a true second-order model in both the mixture and process variables and then to apply the mixture constraint. The mixture constraint is subtle and can produce several models, each with a different number of terms. A fundamental assumption underlying the KCV designs is that the mixture by process variable interactions are of serious interest, especially in production. Typically, corporate R&D develops the basic formulation, often under extremely pristine conditions. Too often, R&D makes the pronouncement that "Thou shall not play with the formula." However, there are situations where production is much smoother if we can take advantage of a mixture component by process variable interaction that improves yields or minimizes a major problem. Of course, that change requires changing the formula.
Cornell (2002) is the definitive text for all things dealing with mixture experiments. It covers every possible model for every situation. However, John in his research always tended to treat the process variables as nuisance. In fact, John's intuitions on Taguchi's combined array go back to the famous fish patty experiment in his book. The fish patty experiment looked at combining three different types of fish and involved three different processing conditions. John's intuition was how to create the best formulation robust to the processing conditions, recognizing that the use of these fish patties was in a major fast-food chain. The processing conditions in actual practice typically were in the hands of teenagers who may or may not follow the protocol precisely.
John's basic instincts followed the corporate R&D-production divide. He rarely, if ever, truly worried about the mixture by process variable interactions. In addition, his first instinct always was to cross a full mixture component experiment with a full factorial experiment in the process variables. If he needed to fractionate a mixture-process experiment, he always fractionated the process variable experiment, because it primarily provided the "noise".
The basic KCV approach reversed the focus. Why can we not fractionate the mixture experiment in such a way that if a process variable is not significant, the resulting design projects down to a standard full mixture experiment? In the process, we also can see the impact of possible mixture by process variable interactions.
I still vividly remember when Scott presented the basic idea in his very first dissertation committee meeting. Of course, John Cornell was on Scott's committee. In Scott's first committee meeting, he outlined the full second-order model in both the mixture and process variables and then proceeded to apply the mixture constraint in such a way as to preserve the mixture by process variable interactions. John, who was not the biggest fan of optimal designs when a standard mixture experiment would work well, immediately jumped up and ran to the board where Scott was presenting the basic idea. John was afraid that we were proposing to use this model and apply our favorite D-optimal algorithm, which may or may not look like a standard mixture design. John and I were very good friends. I simply told him to sit down and wait a few minutes. He reluctantly did. Five minutes later, Scott presented our design strategy for the basic KCV designs, illustrating the projection properties where if a process variable was unimportant the mixture design collapsed to a standard full mixture experiment. John saw that this approach addressed his basic concerns about the blind use of an optimal design algorithm. He immediately became a convert, hence the C in KCV. He saw that we were basically crossing a good design in the process variables, which itself could be a fraction, with a clever fraction of the mixture component experiment.
John's preference to cross a mixture experiment with a process variable design meant that it was very easy to extend these designs to split-plot structures. As a result, we had two very natural chapters for Scott's dissertation. The first paper (Kowalski, Cornell, and Vining 2000) appeared in Communications in Statistics in a special issue guest edited by Norman Draper. The second paper (Kowalski, Cornell, and Vining 2002) appeared in Technometrics.
There are several benefits to the KCV design strategy. First, these designs have very nice projection properties. Of course, they were constructed specifically to achieve this goal. Second, it can significantly reduce the overall design size while still preserving the ability to estimate highly informative models. Third, unlike the approach that I taught in Ohio, the KCV designs cover the mixture experimental design space much better while still providing the equivalent information. The underlying models for both approaches are equivalent.
It has been very gratifying to see Design-Expert incorporate the KCV designs. We hope that Design-Expert users find them valuable.
References
Cornell, J.A. (2002). Experiments with Mixtures: Designs, Models, and the Analysis of Mixture Data, 3rd ed. NewYork: John Wiley and Sons.
Kowalski, S.M., Cornell, J.A., and Vining, G.G. (2000). “A New Model and Class of Designs for Mixture Experiments with Process Variables,” Communications in Statistics – Theory and Methods, 29, pp. 2255-2280.
Kowalski, S.M., Cornell, J.A., and Vining, G.G. (2002). “Split-Plot Designs and Estimation Methods for Mixture Experiments with Process Variables,” Technometrics, 44, pp. 72-79.
Greg’s DOE Adventure - Simple Comparisons
Disclaimer: I’m not a statistician. Nor do I want you to think that I am. I am a marketing guy (with a few years of biochemistry lab experience) learning the basics of statistics, design of experiments (DOE) in particular. This series of blog posts is meant to be a light-hearted chronicle of my travels in the land of DOE, not be a textbook for statistics. So please, take it as it is meant to be taken. Thanks!
As I learn about design of experiments, it’s natural to start with simple concepts; such as an experiment where one of the inputs is changed to see if the output changes. That seems simple enough.
For example, let’s say you know from historical data that if 100 children brush their teeth with a certain toothpaste for six months, 10 will have cavities. What happens when you change the toothpaste? Does the number with cavities go up, down, or stay the same? That is a simple comparative experiment.
“Well then,” I say, “if you change the toothpaste and 6 months later 9 children have cavities, then that’s an improvement.”
Not so fast, I’m told. I’ve already forgotten about that thing called variability that I defined in my last post. Great.
In that first example, where 10 kids got cavities. That result comes from that particular sample of 100 kids. A different sample of 100 kids may produce an outcome of 9, other times it’s 11. There is some variability in there. It’s not 10 every time.
[Note: You can and should remove as much variability as you can. Make sure the children brush their teeth twice a day. Make sure it’s for exactly 2 minutes each time. But there is still going to be some variation in the experiment. Some kids are just more prone to cavities than others.]
How do you know when your observed differences are due to the changes to the inputs, and not from the variation?
It’s called the F-Test.
I’ve seen it written as:
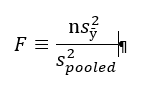
Where:
s = standard deviation
s2 = variance
n = sample size
y = response
ӯ (“y bar”) = average response
In essence, this is the amount of variance for individual observations in the new experiment (multiplied by the number of observations) divided by the total variation in the experiment.
Now that, by itself, does not mean much to me (see disclaimer above!). But I was told to think of it as the ratio of signal to noise. The top part of that equation is the amount of signal you are getting from the new condition; it’s the amount of change you are seeing from the established mean with the change you made (new toothpaste). The bottom part is the total variation you see in all your data. So, the way I’m interpreting this F-Test is (again, see disclaimer above): measuring the amount of change you see versus the amount of change that is naturally there.
If that ratio is equal to 1, more than likely there is no difference between the two. In our example, changing the toothpaste probably makes no difference in the number of cavities.
As the F-value goes up, then we start to see differences that can likely be credited to the new toothpaste. The higher the value of the F-test, the less likely it is that we are seeing that difference by chance and the more likely it is due to the change in the input (toothpaste).
Trivia
Question: Why is this thing called an F-Test?
Answer: It is named after Sir Ronald Fisher. He was a geneticist who developed this test while working on some agricultural experiments. “Gee Greg, what kind of experiments?”. He was looking at how different kinds of manure effected the growth of potatoes. Yup. How “Peculiar Poop Promotes Potato Plants”. At least that would have been my title for the research.
Four Tips for Graduate Students' Research Projects
Graduate students are frequently expected to use design of experiments (DOE) in their thesis project, often without much DOE background or support. This results in some classic mistakes.
- Designs that were popular in the 1970’s-1990’s (before computers were widely available) have been replaced with more sophisticated alternatives. A common mistake – using a Plackett-Burman (PB) design for either screening purposes, or to gain process understanding for a system that is highly likely to have interactions. PB designs are badly aliased resolution III, thus any interactions present in the system will cause many of the main effect estimates to be biased. This increases the internal noise of the design and can easily cause misleading and inaccurate results. Better designs for screening are regular two-level factorials at resolution IV or minimum-run (MR) designs. For details on PB, regular and MR designs, read DOE Simplified.
- Reducing the number of replicated points will likely result in losing important information. A common mistake – reducing the number of center points in a response surface design down to one. The replicated center points provide an estimate of pure error, which is necessary to calculate the lack of fit statistic. Perhaps even more importantly, they reduce the standard error of prediction in the middle of the design space. Eliminating the replication may mean that results in the middle of the design space (where the optimum is likely to be) have more prediction error than results at the edges of the design space!
- If you plan to use DOE software to analyze the results, then use the same software at the start to create the design. A common mistake – designing the experiment based on traditional engineering practices, rather than on statistical best practices. The software very likely has recommended defaults that will make a better design that what you can plan on your own.
- Plan your experimentation budget to include confirmation runs after the DOE has been run and analyzed. A common mistake – assuming that the DOE results will be perfectly correct! In the real world, a process is not improved unless the results can be proven. It is necessary to return to the process and test the optimum settings to verify the results.
The number one thing to remember is this: Using previous student’s theses as a basis for yours, means that you may be repeating their mistakes and propagating poor practices! Don’t be afraid to forge a new path and showcase your talent for using state-of-the-art statistical designs and best practices.
Greg's DOE Adventure: Important Statistical Concepts behind DOE
If you read my previous post, you will remember that design of experiments (DOE) is a systematic method used to find cause and effect. That systematic method includes a lot of (frightening music here!) statistics.
[I’ll be honest here. I was a biology major in college. I was forced to take a statistics course or two. I didn’t really understand why I had to take it. I also didn’t understand what was being taught. I know a lot of others who didn’t understand it as well. But it’s now starting to come into focus.]
Before getting into the concepts of DOE, we must get into the basic concepts of statistics (as they relate to DOE).
Basic Statistical Concepts:
Variability
In an experiment or process, you have inputs you control, the output you measure, and uncontrollable factors that influence the process (things like humidity). These uncontrollable factors (along with other things like sampling differences and measurement error) are what lead to variation in your results.
Mean/Average
We all pretty much know what this is right? Add up all your scores, divide by the number of scores, and you have the average score.
Normal distribution
Also known as a bell curve due to its shape. The peak of the curve is the average, and then it tails off to the left and right.
Variance
Variance is a measure of the variability in a system (see above). Let’s say you have a bunch of data points for an experiment. You can find the average of those points (above). For each data point subtract that average (so you see how far away each piece of data is away from the average). Then square that. Why? That way you get rid of the negative numbers; we only want positive numbers. Why? Because the next step is to add them all up, and you want a sum of all the differences without negative numbers getting in the way. Now divide that number by the number of data points you started with. You are essentially taking an average of the squares of the differences from the mean.
That is your variance. Summarized by the following equation:
In this equation:
Yi is a data point
Ȳ is the average of all the data points
n is the number of data points
Standard Deviation
Take the square root of the variance. The variance is the average of the squares of the differences from the mean. Now you are taking the square root of that number to get back to the original units. One item I just found out: even though standard deviations are in the original units, you can’t add and subtract them. You have to keep it as variance (s2), do your math, then convert back.