Greg’s DOE Adventure - Simple Comparisons
Disclaimer: I’m not a statistician. Nor do I want you to think that I am. I am a marketing guy (with a few years of biochemistry lab experience) learning the basics of statistics, design of experiments (DOE) in particular. This series of blog posts is meant to be a light-hearted chronicle of my travels in the land of DOE, not be a textbook for statistics. So please, take it as it is meant to be taken. Thanks!
As I learn about design of experiments, it’s natural to start with simple concepts; such as an experiment where one of the inputs is changed to see if the output changes. That seems simple enough.
For example, let’s say you know from historical data that if 100 children brush their teeth with a certain toothpaste for six months, 10 will have cavities. What happens when you change the toothpaste? Does the number with cavities go up, down, or stay the same? That is a simple comparative experiment.
“Well then,” I say, “if you change the toothpaste and 6 months later 9 children have cavities, then that’s an improvement.”
Not so fast, I’m told. I’ve already forgotten about that thing called variability that I defined in my last post. Great.
In that first example, where 10 kids got cavities. That result comes from that particular sample of 100 kids. A different sample of 100 kids may produce an outcome of 9, other times it’s 11. There is some variability in there. It’s not 10 every time.
[Note: You can and should remove as much variability as you can. Make sure the children brush their teeth twice a day. Make sure it’s for exactly 2 minutes each time. But there is still going to be some variation in the experiment. Some kids are just more prone to cavities than others.]
How do you know when your observed differences are due to the changes to the inputs, and not from the variation?
It’s called the F-Test.
I’ve seen it written as:
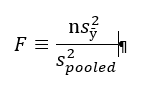
Where:
s = standard deviation
s2 = variance
n = sample size
y = response
ӯ (“y bar”) = average response
In essence, this is the amount of variance for individual observations in the new experiment (multiplied by the number of observations) divided by the total variation in the experiment.
Now that, by itself, does not mean much to me (see disclaimer above!). But I was told to think of it as the ratio of signal to noise. The top part of that equation is the amount of signal you are getting from the new condition; it’s the amount of change you are seeing from the established mean with the change you made (new toothpaste). The bottom part is the total variation you see in all your data. So, the way I’m interpreting this F-Test is (again, see disclaimer above): measuring the amount of change you see versus the amount of change that is naturally there.
If that ratio is equal to 1, more than likely there is no difference between the two. In our example, changing the toothpaste probably makes no difference in the number of cavities.
As the F-value goes up, then we start to see differences that can likely be credited to the new toothpaste. The higher the value of the F-test, the less likely it is that we are seeing that difference by chance and the more likely it is due to the change in the input (toothpaste).
Trivia
Question: Why is this thing called an F-Test?
Answer: It is named after Sir Ronald Fisher. He was a geneticist who developed this test while working on some agricultural experiments. “Gee Greg, what kind of experiments?”. He was looking at how different kinds of manure effected the growth of potatoes. Yup. How “Peculiar Poop Promotes Potato Plants”. At least that would have been my title for the research.