Stat-Ease Blog

Categories
Tips and tricks for designing statistically optimal experiments
Like the blog? Never miss a post - sign up for our blog post mailing list.
A fellow chemical engineer recently asked our StatHelp team about setting up a response surface method (RSM) process optimization aimed at establishing the boundaries of his system and finding the peak of performance. He had been going with the Stat-Ease software default of I-optimality for custom RSM designs. However, it seemed to him that this optimality “focuses more on the extremes” than modified distance or distance.
My short answer, published in our September-October 2025 DOE FAQ Alert, is that I do not completely agree that I-optimality tends to be too extreme. It actually does a lot better at putting points in the interior than D-optimality as shown in Figure 2 of "Practical Aspects for Designing Statistically Optimal Experiments." For that reason, Stat-Ease software defaults to I-optimal design for optimization and D-optimal for screening (process factorials or extreme-vertices mixture).
I also advised this engineer to keep in mind that, if users go along with the I-optimality recommended for custom RSM designs and keep the 5 lack-of-fit points added by default using a distance-based algorithm, they achieve an outstanding combination of ideally located model points plus other points that fill in the gaps.
For a more comprehensive answer, I will now illustrate via a simple two-factor case how the choice of optimality parameters in Stat-Ease software affects the layout of design points. I will finish up with a tip for creating custom RSM designs that may be more practical than ones created by the software strictly based on optimality.
An illustrative case
To explore options for optimal design, I rebuilt the two-factor multilinearly constrained “Reactive Extrusion” data provided via Stat-Ease program Help to accompany the software’s Optimal Design tutorial via three options for the criteria: I vs D vs modified distance. (Stat-Ease software offers other options, but these three provided a good array to address the user’s question.)
For my first round of designs, I specified coordinate exchange for point selection aimed at fitting a quadratic model. (The default option tries both coordinate and point exchange. Coordinate exchange usually wins out, but not always due to the random seed in the selection algorithm. I did not want to take that chance.)
As shown in Figure 1, I added 3 additional model points for increased precision and kept the default numbers of 5 each for the lack-of-fit and replicate points.
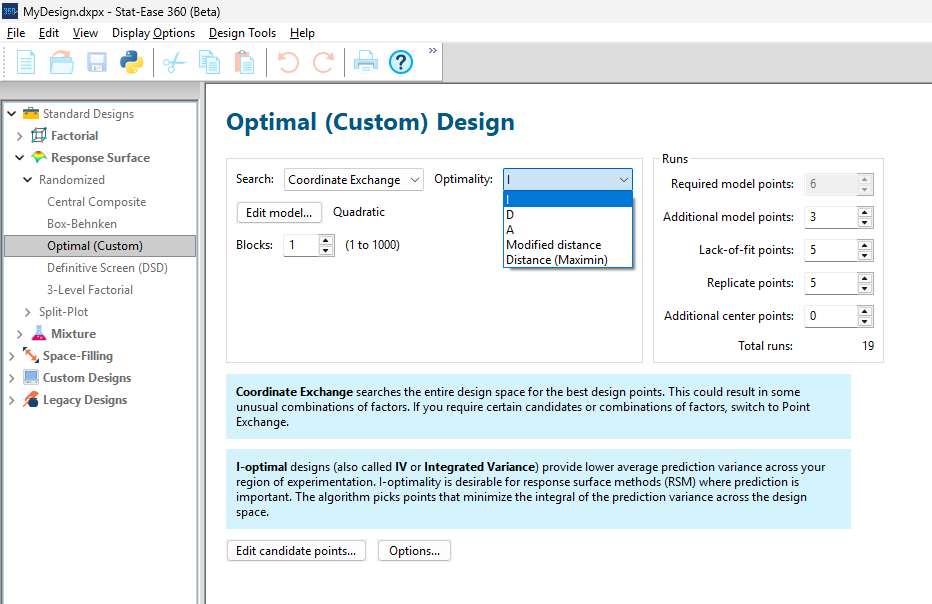
Figure 1: Set up for three alternative designs—I (default) versus D versus modified distance
As seen in Figure 2’s contour graphs produced by Stat-Ease software’s design evaluation tools for assessing standard error throughout the experimental region, the differences in point location are trivial for only two factors. (Replicated points display the number 2 next to their location.)
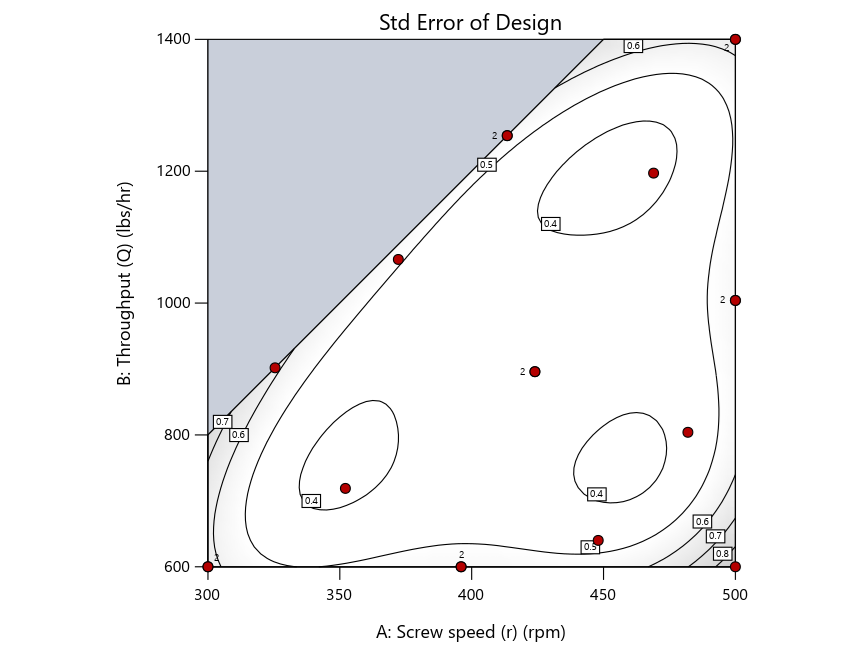
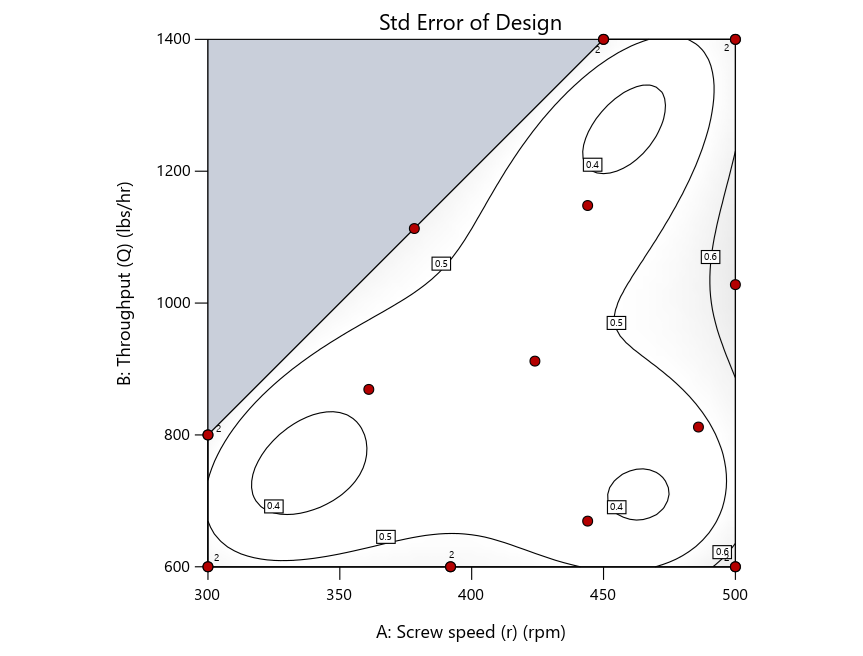
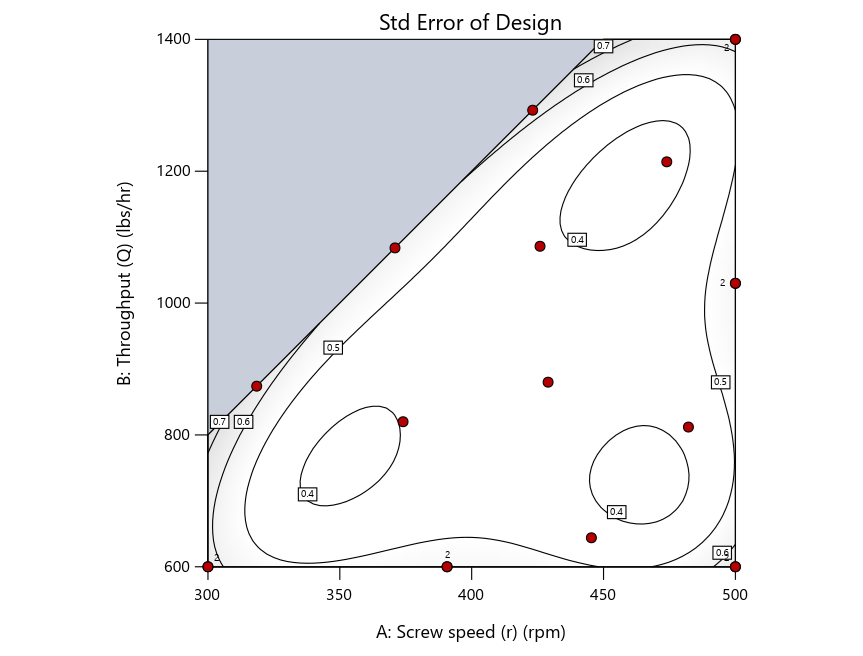
Figure 2: Designs built by I vs D vs modified distance including 5 lack-of-fit points (left to right)
Keeping in mind that, due to the random seed in our algorithm, run-settings vary when rebuilding designs, I removed the lack-of-fit points (and replicates) to create the graphs in Figure 2.
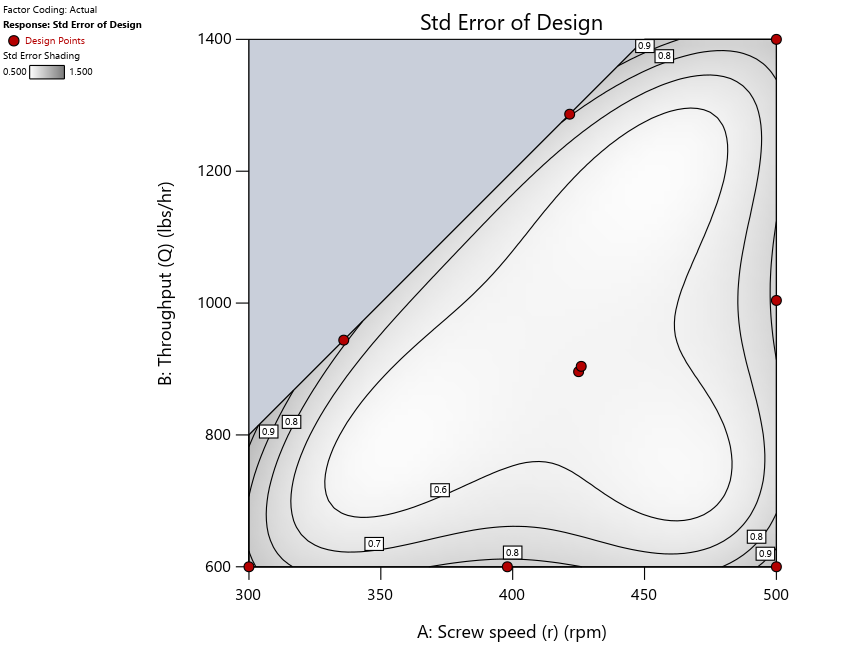

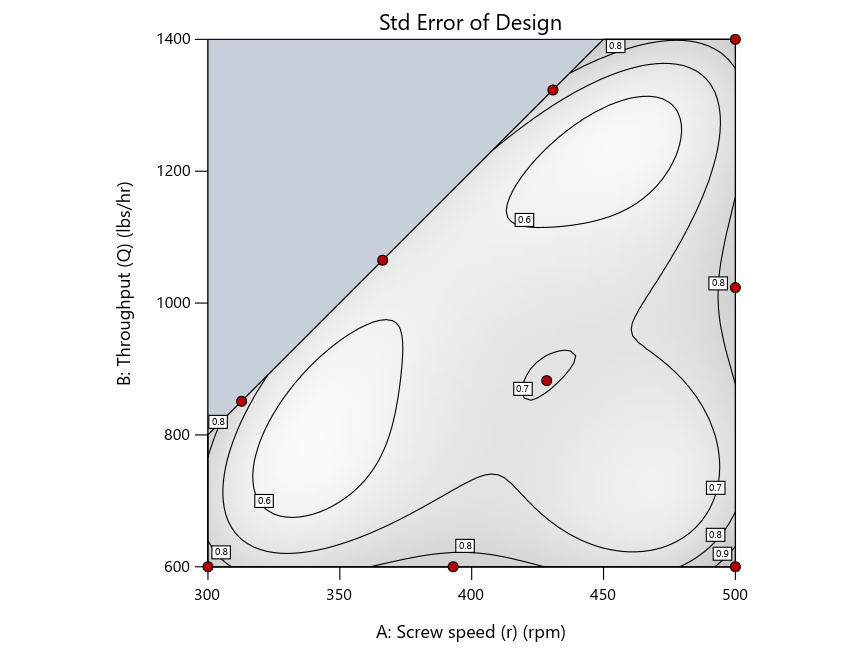
Figure 3: Designs built by I vs D vs modified distance excluding lack-of-fit points (left to right)
Now you can see that D-optimal designs put points around the outside, whereas I-optimal designs put points in the interior, and the space-filling criterion spreads the points around. Due to the lack of points in the interior, the D-optimal design in this scenario features a big increase in standard error as seen by the darker shading—a very helpful graphical feature in Stat-Ease software. It is the loser as a criterion for a custom RSM design. The I-optimal wins by providing the lowest standard error throughout the interior as indicated by the light shading. Modified distance base selection comes close to I optimal but comes up a bit short—I award it second place, but it would not bother me if a user liking a better spread of their design points make it their choice.
In conclusion, as I advised in my DOE FAQ Alert, to keep things simple, accept the Stat-Ease software custom-design defaults of I optimality with 5 lack-of-fit points included and 5 replicate points. If you need more precision, add extra model points. If the default design is too big, cut back to 3 lack-of-fit points included and 3 replicate points. When in a desperate situation requiring an absolute minimum of runs, zero out the optional points and ignore the warning that Stat-Ease software pops up (a practice that I do not generally recommend!).
A practical tip for point selection
Look closely at the I-optimal design created by coordinate exchange in Figure 3 on the left and notice that two points are placed in nearly the same location (you may need a magnifying glass to see the offset!). To avoid nonsensical run specifications like this, I prefer to force the exchange algorithm to point selection. This restricts design points to a geometrically registered candidate set, that is, the points cannot move freely to any location in the experimental region as allowed by coordinate exchange.
Figure 4 shows the location of runs for the reactive-extrusion experiment with point selection specified.
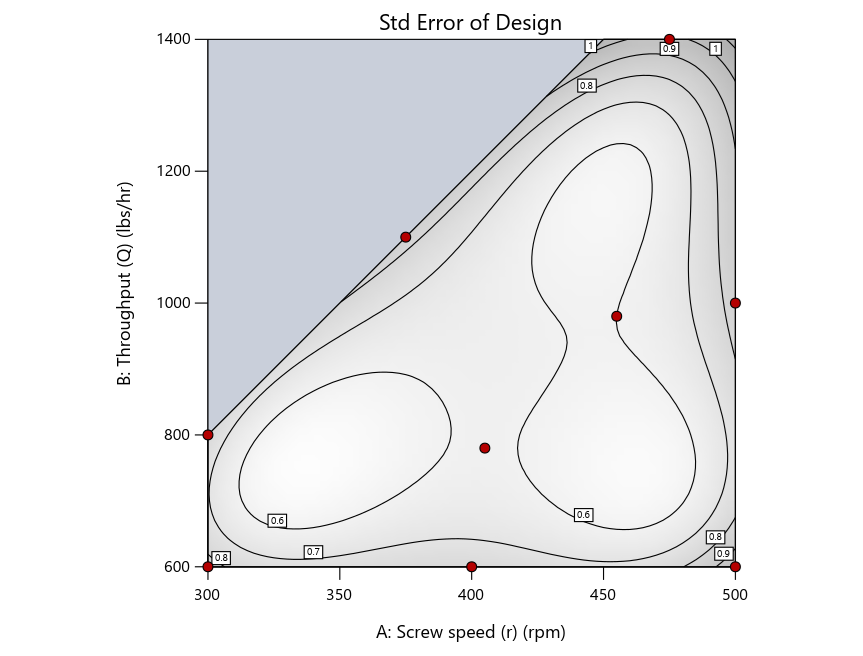
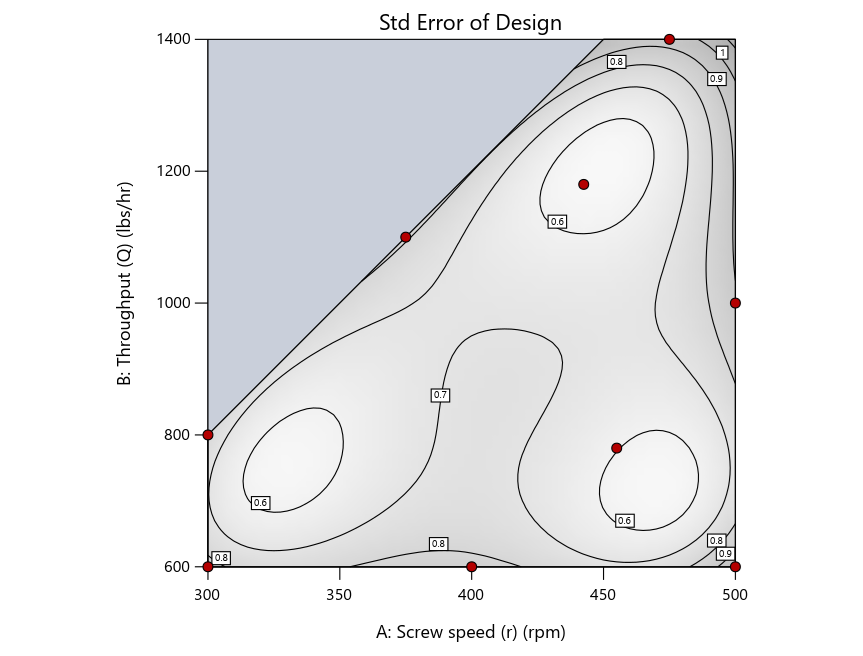
Figure 4: Designs built by I vs D vs modified distance by point exchange (left to right)
The D optimal remains a bad choice—the same as before. The edge for I optimal over modified distance narrows due to point exchange not performing quite as well for as coordinate exchange.
As an engineer with a wealth of experience doing process development, I like the point exchange because it:
- Reaches out for the ‘corners’—the vertices in the design space,
- Restricts runs to specific locations, and
- Allows users to see where they are by showing space point type on the design layout enabled via a right-click over the upper left corner.
Figures 5a and 5b illustrate this advantage of point over coordinate exchange.
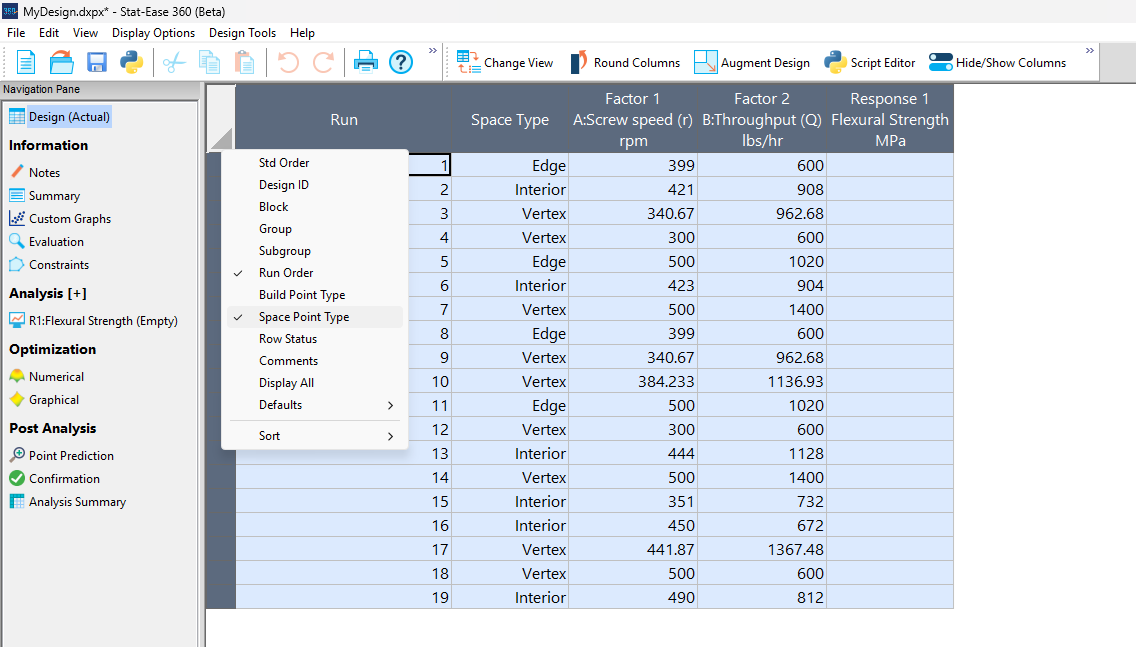
Figure 5a: Design built by coordinate exchange with Space Point Type toggled on
On the table displayed in Figure 5a for a design built by coordinate exchange, notice how points are identified as “Vertex” (good the software recognized this!), “Edge” (not very specific) and “Interior” (only somewhat helpful).
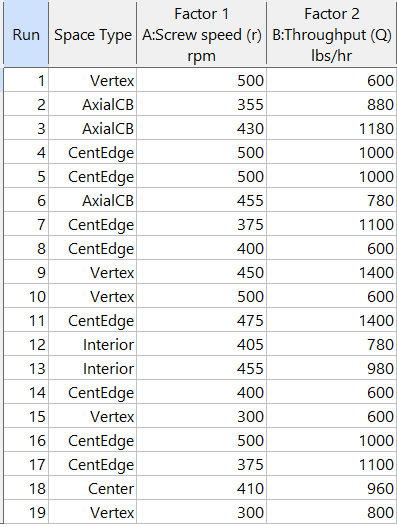
Figure 5b: Design built by point exchange with Space Point Type shown
As shown by Figure 5b, rebuilding the design via point exchange produces more meaningful identification of locations (and better registered geometrically): “Vertex” (a corner), “CentEdge” (center of edge—a good place to make a run), “Center” (another logical selection) and “Interior” (best bring up the contour graph via design evaluation to work out where these are located—click any point to identify them by run number).
Full disclosure: There is a downside to point exchange—as the number of factors increases beyond 12, the candidate set becomes excessive and thus the build takes more time than you may be willing to accept. Therefore, Stat-Ease software recommends going only with the far faster coordinate exchange. If you override this suggestion and persist with point exchange, no worries—during the build you can cancel it and switch to coordinate exchange.
Final words
A fellow chemical engineer often chastised me by saying “Mark, you are overthinking things again.” Sorry about that. If you prefer to keep things simple (and keep statisticians happy!), go with the Stat-Ease software defaults for optimal designs. Allow it to run both exchanges and choose the most optimal one, even though this will likely be the coordinate exchange. Then use the handy Round Columns tool (seen atop Figure 5a) to reduce the number of decimal places on impossibly precise settings.
Like the blog? Never miss a post - sign up for our blog post mailing list.
July Publication Roundup
Here's the latest Publication Roundup! In these monthly posts, we'll feature recent papers that cited Design-Expert® or Stat-Ease® 360 software. Please submit your paper to us if you haven't seen it featured yet!
Featured Articles
Microwave-assisted extraction of bioactive compounds from Urtica dioica using solvent-based process optimization and characterization
Scientific Reports volume 15, Article number: 25375 (2025)
Authors: Anjali Sahal, Afzal Hussain, Ritesh Mishra, Sakshi Pandey, Ankita Dobhal, Waseem Ahmad, Vinod Kumar, Umesh Chandra Lohani, Sanjay Kumar
Mark's comments: Kudos to this team for deploying a Box-Behnken response-surface-method design--convenient by only requiring 3 levels of each of their 3 factors (power, time and sample-to-solvent ratio)--to optimize their process. Given all the raw data I was able to easily copy it out and import it into my Stat-Ease software and check into the modeling--no major issues uncovered. The authors did well by diagnosing residuals and making use of our numerical optimization tools to find the most desirable factor combination for their multiple-response goals.
Be sure to check out this important study, and the other research listed below!
More new publications from July
- Improving the heterotrophic media of three Chlorella vulgaris mutants toward optimal color, biomass and protein productivity
Scientific Reports volume 15, Article number: 23325 (2025)
Authors: Mafalda Trovão, Miguel Cunha, Gonçalo Espírito Santo, Humberto Pedroso, Ana Reis, Ana Barros, Nádia Correia, Lisa Schüler, Monya Costa, Sara Ferreira, Helena Cardoso, Márcia Ventura, João Varela, Joana Silva, Filomena Freitas, Hugo Pereira - Calibration and establishment for the discrete element simulation parameters of pepper stem during harvest period
Scientific Reports volume 15, Article number: 21143 (2025)
Authors: Jiaxuan Yang, Jin Lei, Xinyan Qin, Zhi Wang, Jianglong Zhang, Lijian Lu - Design Expert Software Being Used to Explore the Factors Affecting the “Water Garden”
American Journal of Analytical Chemistry, 16, 107-116
Authors: Zelin Miu, Yichen Lu - Quality improvement of recycled carbon black from waste tire pyrolysis for replacing carbon black N330
Scientific Reports volume 15, Article number: 23726 (2025)
Authors: Tawan Laithong, Tarinee Nampitch, Peerapon Ourapeepon, Natacha Phetyim - Development and in vitro characterization of embelin bilosomes for enhanced oral bioavailability
Journal of Research in Pharmacy, Year 2025, Volume: 29 Issue: 4, 1616 - 1626, 05.07.2025
Authors: Shreya Firake Devanshi Pethani Jeet Patil Avinash Bhujbal Rahul Gondake Dhanashree Sanap , Sneha Agrawal - Performance optimization and mechanism research of C20 coal gangue concrete based on response surface and water resistance
AIP Advances, 15, 075316 (2025)
Authors: Yong Cui, Xiwen Yin, Qiuge Yu - Multi-objective optimization of boiler combustion efficiency and emissions using genetic algorithm and recurrent neural network in 660-MW coal-fired power plant
Eastern-European Journal of Enterprise Technologies, 3(8 (135), 23–33
Authors: Mohamad Arwan Efendy, Ahmad Syihan Auzani, Sholahudin Sholahudin - Optimization and characterization of polyhydroxybutyrate produced by Vreelandella piezotolerans using orange peel waste
Scientific Reports volume 15, Article number: 25873 (2025)
Authors: Mahmoud H. Hendy, Amr M. Shehabeldine, Amr H. Hashem, Ahmed F. El-Sayed, Hussein H El-Sheikh - Multi-functional electrodialysis process to treat hyper-saline reverse osmosis brine: producing high value-added HCl, NaOH and energy consumption calculation
Environmental Sciences Europe volume 37, Article number: 121 (2025)
Authors: Haia M. Elsayd, Gamal K. Hassan, Ahmed A. Affy, M. Hanafy, Tamer S. Ahmed - Quality by Design-Based Method for Simultaneous Determination of Glimepiride and Lovastatin in Self-Nano Emulsifying Drug Delivery System
Separation Science Plus, 8: e70097
Authors: Priyanka Paul, Raj Kamal, Thakur Gurjeet Singh, Ankit Awasthi, Rohit Bhatia - Sustainable Adsorbents for Wastewater Treatment: Template-Free Mesoporous Silica from Coal Fly Ash
Chemical Engineering & Technology, 48: e70077
Authors: Thapelo Manyepedza, Emmanuel Gaolefufa, Gaone Koodirile, Dr. Isaac N. Beas, Dr. Joshua Gorimbo, Bakang Modukanele, Dr. Moses T. Kabomo
June 2025 Publication Roundup
Here's the latest Publication Roundup! In these monthly posts, we'll feature recent papers that cited Design-Expert® or Stat-Ease® 360 software. Please submit your paper to us if you haven't seen it featured yet!
Featured Article
Orange-Fleshed Sweet Potatoes, Grain Amaranth, Biofortified Beans, and Maize Composite Flour Formulation Optimization and Product Characterization
Food Science and Nutrition, Volume 13, Issue 6. June 2025.
Authors: Julius Byamukama, Robert Mugabi, Dorothy Nakimbugwe, John Muyonga
Mark's comments: "It's good to see response surface methods for optimization of food recipes via mixture design. I appreciate publications that include all the data needed to assess the predictive modeling. Kudus to EU for funding research like this that alleviates malnutrition in vulnerable populations."
Be sure to check out this important study, and the other research listed below!
More new publications from June
- Optimization and induction effect evaluation of complex inducer of Aquilaria sinensis based on factorial design
Scientific Reports, volume 15, Article number: 19656 (2025)
Authors: Qiuyue Ding, Baoyi Qin, Shimin Deng, Jie Chen, Ziwei Liu, Weiping Zhou, Xiaoying Chen, Weimin Zhang, Xin Zhou, Xiaoxia Gao - Adsorption of crystal violet using thiazolium ionic liquid-crosslinked alginate hydrogels: Modelling using Box-Behnken experimental design
International Journal of Biological Macromolecules, Volume 318, Part 1, July 2025, 144951
Authors: Merve Ceylan, Jülide Hızal, Elif Nur Özer, Ivaylo Tankov, Rumyana Yankova - High-Performance Ultrathin Membrane with Molecular Arrangement Ordered for Proton Exchange Membrane
ACS Applied Polymer Materials, published June 10, 2025
Authors: Yuqing Zhang, Ailing Zhang, Kaixiang Zhou, Yongjiang Li - Impact of addition of polyvinyl chloride on the properties of clayey soil using experimental approach and optimization for geotechnical engineering applications
Scientific Reports, volume 15, Article number: 19901 (2025)
Authors: Ghania Boukhatem, Said Berdoudi, Messaouda Bencheikh, Mohammed Benzerara, Mehmet Serkan Kırgız, N. Nagaprasad, Krishnaraj Ramaswamy - Copper Corrosion in Blended Diesel-Biodiesel: Corrosion Rate Evaluation and Characterization
Chemical Engineering & Technology, e70053, 12 June 2025
Authors: Lekan Taofeek Popoola, Celestine Chidi Nwogbu, Usman Taura, Yuli Panca Asmara, Alfred Ogbodo Agbo, Paul C. Okonkwo - The Effects of Novel Thymoquinone-Loaded Nanovesicles as a Promising Avenue to Modulate Autism Associated Dysregulation by Restoring Oxidative Stress in Autism in Mice
International Journal of Nanomedicine, 24 June 2025 Volume 2025:20 Pages 8041—8061
Authors: Nermin Eissa, Jana K Alwattar, Petrilla Jayaprakash, Dana Chkier, Aala Osama Ahmed, Anum Ahmed, Rameen Rizwan, Sulthan Mujeeb, Mohamad Rahal, Bassem Sadek
Ask An Expert: Jay Davies
Next in our 40th anniversary “Ask an Expert” blog series is John "Jay" Davies, who's an absolute rock star when it comes to teaching and implementing DOE. He's lent us his expertise before - see this talk from our 2022 Online DOE Summit - and he shared an anecdote with our statistical experts about how he approaches switching to DOE methods when working with new groups in the Army. He kindly agreed to let us publish it as part of this series.
For the past 14 years, I’ve been a Research Physicist with the U.S. Army DEVCOM Chemical Biological Center at Aberdeen Proving Grounds, MD as a member of the Decontamination Sciences Branch, which specializes in developing techniques/chemistries to neutralize chemical warfare agents. I’m dedicated to applied statistical analysis ranging from multi-laboratory precision studies to design of experiments (DOE). The Decontamination Sciences Branch has been integrating DOE methods into many of their chemical agent decontamination research programs.
I’m happy to report that the DOE methods here at the Chemical Biological Center are really catching on. I collaborated on 24 DOEs from 2014 through 2021. Then, in 2021-22, we completed 26 DOEs across 10 different programs. I’ve been doing a lot of mixture-process DOEs with the Bio Sciences groups for synthetic biology and bio manufacturing applications, and once the other groups saw the information that we were getting from just a single day’s worth of data, they too wanted to try DOE.
Lately, I’ve changed the formula that I use for the initial consultations when visiting a group that has expressed an interest in DOE but has never used DOE before. Previously we’d go right into their project, and I’d tell them how we might construct a DOE for their application. However, I’ve found that it’s too much of a culture shock if we go right into talking about what a DOE for their application might look like. Instead, especially if I’m working with a group that has no DOE experience at all, I now devote about 1 hour to discuss DOE methods in general before we even mention their actual application. In this discussion, I reveal the major differences that they are going to see with a DOE, which are:
- We’re not going to replicate every sample, we may even have zero exact replication.
- We’re not going to test every possible combination of factors.
- Sample sizes are going to be 70% to 95% smaller than what they are used to doing.
- We are not going to change “one factor at a time”, in fact we’ll be changing all factors at once.
- The designs might look chaotic, but they are strategically created to contain a hidden orthogonal structure, along with hidden replication, that is not apparent.
- You will see that many of the DOE samples contain factor combinations that don’t seem to make sense. This is because each sample is not designed as a stand-alone shot at optimization. Rather, the samples cumulatively are working in concert to tease out the influences of each factor. This will let us fit a predictive model that we will then use to predict the optimal settings of factors.
Recently, I was following this format with a group that had never used DOE before. We had a great back-and-forth dialog as I went through the bullets above and explained a bit about each point. They asked many questions and were really following along. Then, after about an hour we got into their application and I just sketched out a prototype quadratic mixture-process DOE that I thought would give them a good idea of what the initial DOE might look like, with 30 samples in total. I then went over what some simulated outputs for the DOE generated prediction model might look like. At this point one of them stopped me and with a very perplexed look on his face, said “hold on, hold on…wait a minute here. Are you telling us that if we run just those 30 samples, we would be able to predict the optimal formulation and the optimal process setting for this system?“
This scientist had been following along, asking questions and really absorbing the information in the past hour as we walked through the DOE basics, but I could see that at that moment things were just sinking in. He realized the ramifications of what we had just discussed – typically, this group might have had to run several hundreds of samples to characterize similar systems, but with DOE they would only need about 30 samples. I responded to his question saying, “Yes that’s exactly what I’m telling you. We’ve run dozens of these mixture-process DOEs, many of them much more complex than this system, and they do work.” This individual, a mid-career researcher, then responded, “How is it possible that we have not heard of this stuff before?” I told him, “I can’t give you a good answer to that one.”
And there you have it! Let us know if you want to talk about saving time & money with DOE: our statistical experts and first-in-class software make it easier than ever.
DISTRIBUTION STATEMENT A. Approved for Public Release: Distribution is Unlimited
Ask An Expert: Shari Kraber
Welcome to the first entry in our 40th anniversary Ask An Expert series, where we talk to current and past power users of Design-Expert® and Stat-Ease® 360 software about their experience with design of experiments (DOE) and our software. For this post, we interviewed Shari Kraber, formerly the Client Success Manager, Workshop Manager, and Senior Instructor for Stat-Ease. Shari retired in 2022 after nearly 3 decades of helping clients across all industries learn DOE and implement it to save time & money making breakthrough improvements on their products & processes.
What’s the biggest benefit to educating your team about DOE?
You’ll break the habit of testing changes one at a time. Many systems will have unknown interactions, and only structured DOE test plans will reveal them. Your team will learn a new way of approaching problems, which helps the company in the long run.
You spent so many years helping folks change from one-factor-at-a-time testing to using DOE. What’s something about DOE that more people should know?
Remember that DOE is about trying to get a bunch of information from a small sample of a large process. The analysis does not need to be perfect in order to be useful. Don’t get paralysis by analysis – just find a simple and reasonable model and then CONFIRM the results. You should use software to design and plan the experiments – a good (robust) design will help offset the inevitable problems encountered while running the physical experiment, so that the analysis will be useful enough to make business decisions.
Your background is as a process engineer at 3M, but you always insisted that anyone working with formulations should use mixture designs. Why?
When the response is dependent on the proportions of the ingredients, then two things make this different from a process design:
- The design space changes to accommodate the proportions of the ingredients.
- The polynomial model is a different form (use a Scheffé polynomial) so that the nonlinear components of the system are modeled correctly. A traditional polynomial will NOT model this system correctly!!
So, what’s the best way to train your team on DOE?
I think distance learning is great. Stat-Ease started doing distance-learning training via Zoom during the COVID-19 pandemic, and it remains a popular choice for teams. The big advantage of distance learning is that the massive amount of information provided is more digestible in half-day segments. The in-person training is pretty intense and is not as ideal educationally. Yes, it is nice to have a live trainer, but honestly the retention of the materials is BETTER using distance learning.
Finally, what features of Stat-Ease software do you want more folks to know about?
I have quite a few recommendations!
First, there are several great editing features if you right-click on any graphs in the software:
- Edit axes
- Plant flags (then right-click on them to edit info)
- Graph Preferences to edit font sizes, colors, display options
And some more:
- Confirmation node – add the settings for the confirmation runs that you want to do and it provides the 95% interval that should contain the mean of those runs.
- You can change the layout options when you have multiple tabs or windows in your analysis. The green + allows you to add more graphs to the display, such as viewing 2 interaction graphs at once, or a contour and 3D plot at the same time.
- In the Analysis Summary, the Coefficients Table can be Transposed by right-clicking on the top left corner square. (Transpose is now available on all tables, but particularly helpful on this one.)
If you’re ready to train your team on DOE, check out our public training options or email us with your questions. Shari still teaches classes on a part-time basis, and our whole team would love to get you rolling with best practices for DOE.