Python Introduction (Stat-Ease 360® only)
Introduction
This tutorial will help you get set up to use the Python integration feature in Stat-Ease software. It will show you how to install and set up a Python virtual environment and connect it to Stat-Ease. The tutorial will also go through creating a simple Python script that extends the functionality of Stat-Ease by graphing multiple different plots in a grid.
While you don’t need any particular Python expertise to use this tutorial, it is not intended to teach you how to become proficient with Python itself. If you are a Python beginner, you may want to look into the resources the Python Software Foundation has provided on their Getting Started page.
Installing Python
First, if you don’t already have it, download and install Python from python.org. You will need at least version 3.7.
On Windows make sure you add it to the PATH using the checkbox at the bottom.

Virtual Environment
Bring up the Command Prompt by pressing the Windows Key + R, then typing in
cmd and pressing OK.

Make a note of the directory you’re in, should be something like
C:\Users\username. We’re going to create a “virtual” Python environment
in this folder that will store the packages we need in an isolation from
your main Python installation. Enter the following command:
python -m venv statease_env

This will create a virtual environment in a folder called “statease_env”.
Activate that environment by typing statease_env\Scripts\activate.bat
and pressing enter.
statease_env\Scripts\activate.bat
Note that your command line changed to include the environment name in it,
e.g. (statease_env) C:\Users\username. That indicates that any Python-related
commands you run will take place in that environment, and any packages you
install will only be available in that environment.
Finally you’ll need to install the statease client that will interface with Stat-Ease. This package is available on pypi.org and can be installed using the standard Python package manager, pip.
pip install statease

Note
You can ignore the warning about pip being out of date, it will not affect the functionality of Stat-Ease 360.
The next step will be to configure Stat-Ease to use the virtual Python environment we just created.
Connecting Python to Stat-Ease
Open Stat-Ease. Click on the Python icon ![]() in the toolbar, or open the
Design Tools menu and select Script Editor. Once you have the script
editor up, open the File menu and select Set Python Environment….
in the toolbar, or open the
Design Tools menu and select Script Editor. Once you have the script
editor up, open the File menu and select Set Python Environment….

That will bring up a file selector dialog. Navigate to the virtual environment
folder you created above, and into the Scripts folder within that virtual
environment. For example, my username is hank, so the destination folder is
C:\Users\hank\statease_env\Scripts. Now click Select Folder.

Executing a Python Script
To start out, we’ll write a basic “Hello World” script. In the left side of
the script window, type print("Hello World!"). Then execute the script
from the File menu, or by pressing F5.

Congratulations, you are a Python programmer! Next we’ll try a more ambitious script. Open the Fish Patties data set in the main Stat-Ease window. This is found in the Help -> Tutorial Data menu.

Take a look at the design layout if you like. This is a mixture-process example that studies making patties out of fish. The average texture of the patties is the response. We’ll create a Python script that uses some data from this design to create a few plots that are not normally available in Stat-Ease.
Switch back to the Stat-Ease Script window (or click the Python icon
![]() to re-open it). Copy and paste, or re-type, this histogram code into
the left pane. Then execute it from the File menu, or by pressing F5.
to re-open it). Copy and paste, or re-type, this histogram code into
the left pane. Then execute it from the File menu, or by pressing F5.
import statease as se
import matplotlib.pyplot as plt
se_conn = se.connect()
response = se_conn.get_response("avg texture")
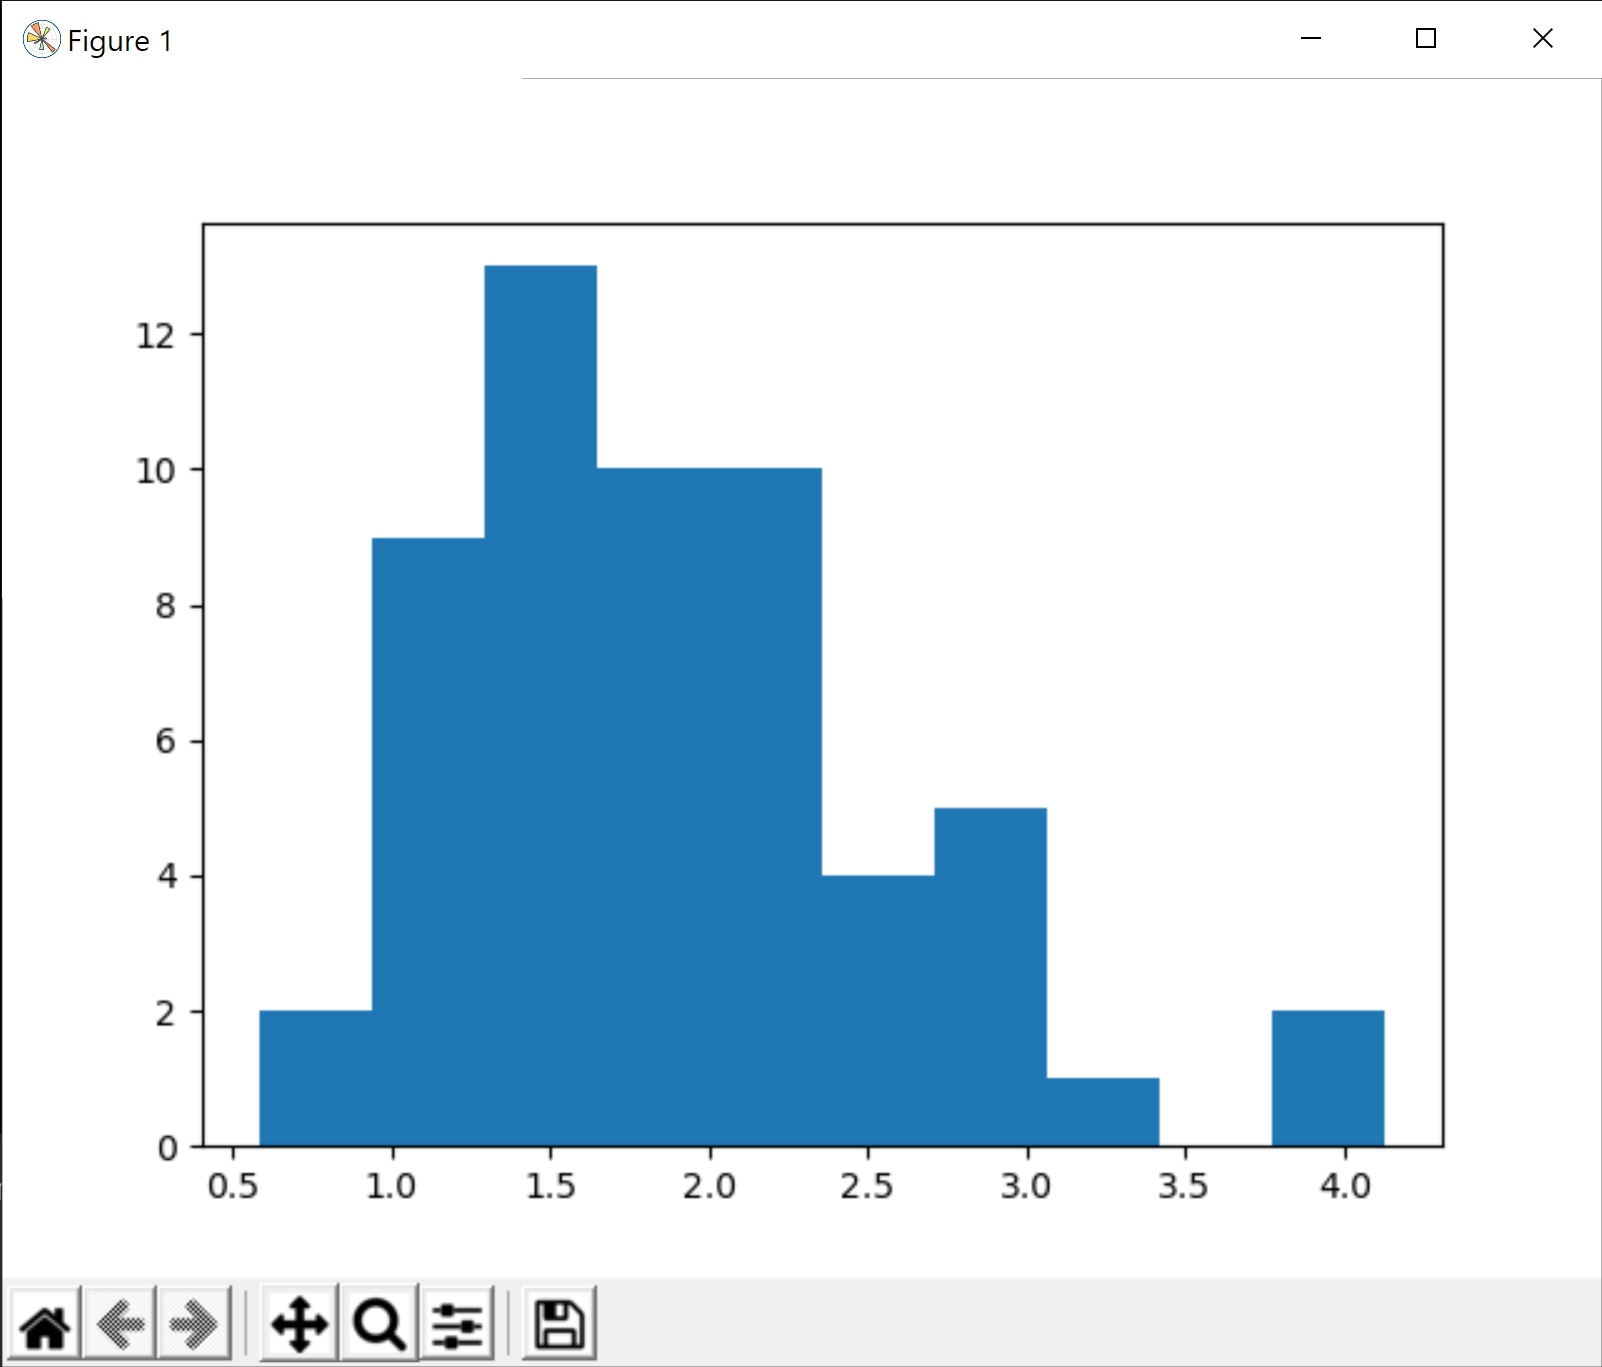
plt.hist(response.values)
plt.show()
At this point you probably got the error
ModuleNotFoundError: No module named ‘matplotlib’. That means you’re
missing matplotlib, which is the de facto standard
for generating plots in Python. Go back to your Command Prompt, or open a
new one by pressing the Windows Key + R, then typing in cmd and
pressing OK. Using your virtual environment, run this command to install the
package:
statease_env\Scripts\activate.bat
pip install matplotlib

Once that has installed, go back to the script window and re-run the histogram code. You should see a pretty basic histogram of the response data.
Not very exciting. We can do the same thing in Stat-Ease’s Graph Columns node. Here is a script that creates 4 different plots arranged in a grid. Replace the code in the left pane of the script window with it, then press F5.
import statease as se
import matplotlib.pyplot as plt

se_conn = se.connect()
factor = se_conn.get_factor("mullet")
factor2 = se_conn.get_factor("sheepshead")
response = se_conn.get_response("avg texture")

fig, axs = plt.subplots(2, 2, figsize=(5, 5))
axs[0, 0].hist(response.values)
axs[0, 1].hist2d(factor.values, response.values)
axs[1, 0].scatter(factor.values, response.values)
axs[1, 1].boxplot(response.values)
plt.show()
It should look something like this:
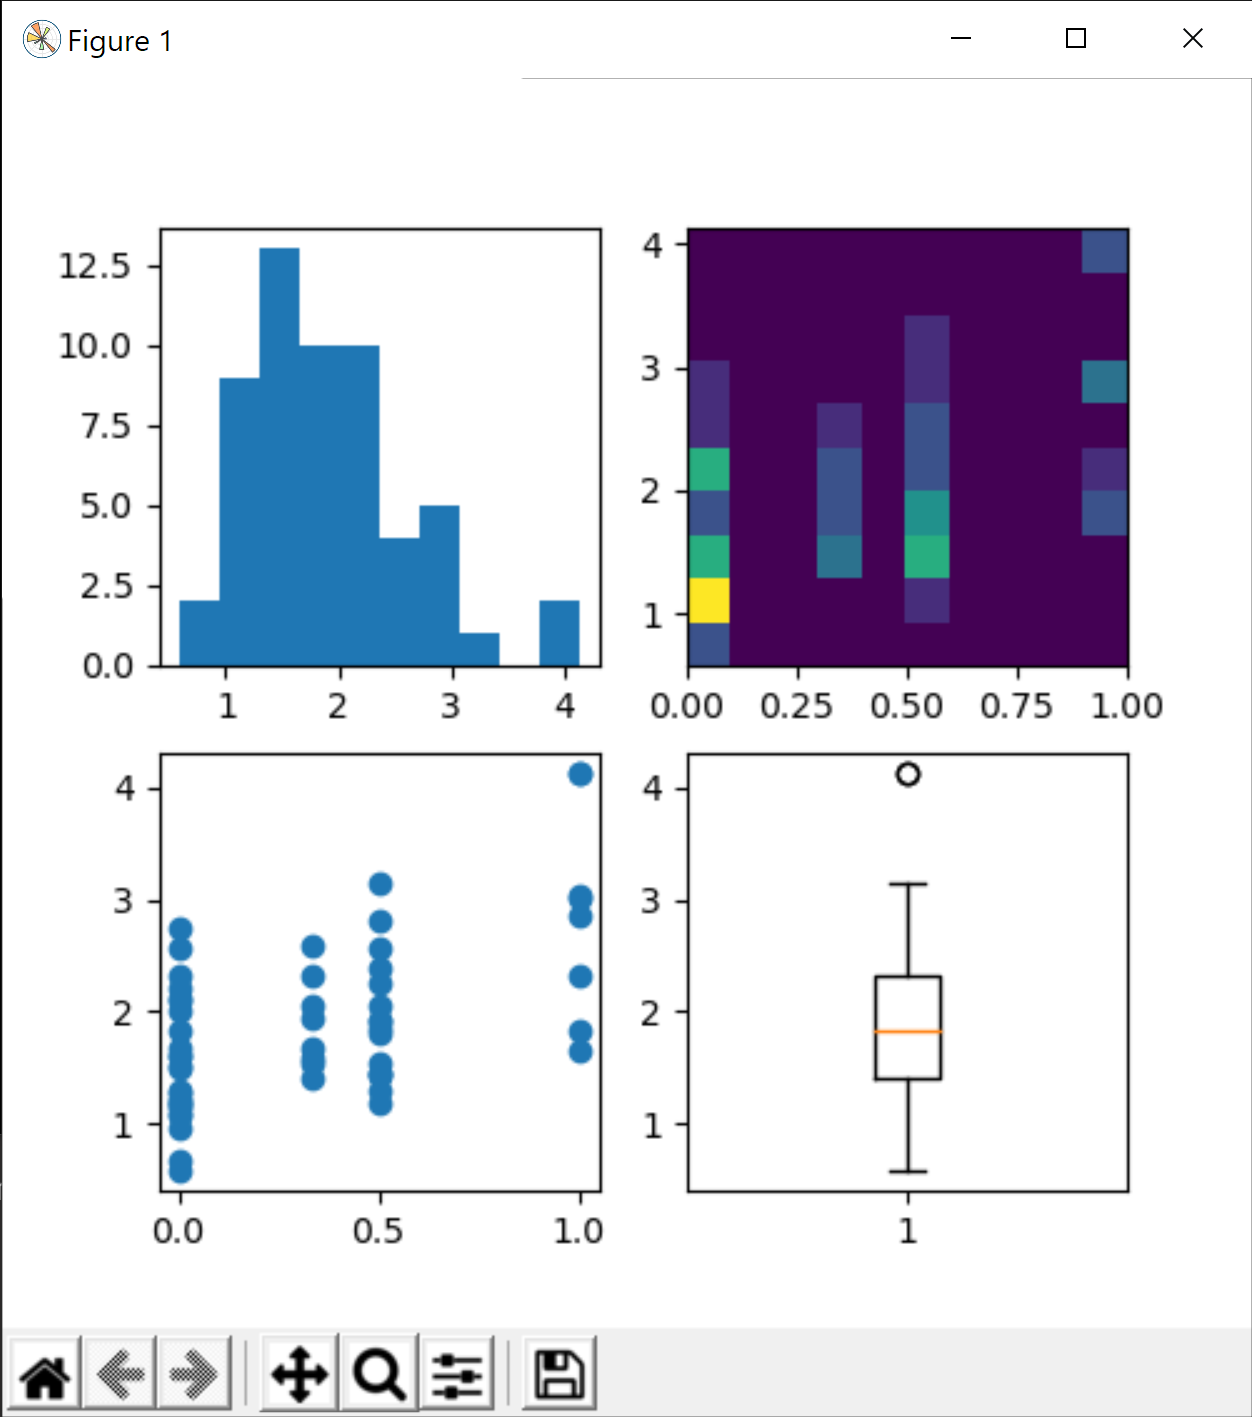
Let’s break down the script a bit. The first two lines tell Python to import
the two modules we need. statease handles the connection to Stat-Ease,
and matplotlib.pyplot does the plotting. The next section of code connects
to Stat-Ease and retrieves two factor columns and a response column. Using
the values from those columns, the last section of code creates a grid of
4 subplots and draws various plots on them.
More information on how to use matplotlib is available in the excellent documentation on their website. The functions and classes available in the statease package are documented here.
A plot isn’t much use without labels, so we’ll add some in the next section.
Example Scripts
Stat-Ease comes with example scripts that are ready to be loaded
directly from the Help menu in the script dialog (not in the main
window!). Try looking under Example Scripts and loading the example
called Multiple Plots. When you click that menu item it should load,
but it is also available here:
multiple-plots.py.
This is essentially the same multiple-plot script we created in the previous section, but it shows how to add axes labels (with superscripts), a legend, and a few other enhancements to those plots. Press F5 and try it out.

This is just barely scratching the surface of what matplotlib can do, much less the thousands of packages available for Python. Try checking out packages like statsmodels for statistical modeling, or scikit-learn for machine learning.