Stat-Teaser April 2016

In this issue:
1. Version 10 of Design-Expert® Software Released!
2. Free Webinar on What's New and Exciting in v10 of Design-Expert® Software by Pat Whitcomb
3. Register Now for the 6th European DOE User Meeting & Workshop May 18-20, 2016 in Leuven, Belgium!
4. Get Up to Speed on DOE with Our Instructor-Led Workshops
5. Complete Your DOE Package with Stat-Ease Consulting Services
6. Practical Aspects for Designing Statistically Optimal Experiments by Mark Anderson
Version 10 of Design-Expert® Software Released!

–– I. M. Kolthoff
- Two-level factorial screening designs: Identify the vital factors that affect your process or product so that you can make breakthrough improvements.
- General factorial studies: Discover the best combination of categorical factors, such as source versus type of raw material supply.
- Response surface methods (RSM): Find the optimal process settings to achieve peak performance.
- Mixture design techniques: Discover the ideal recipe for your product formulation.
- Combinations of process factors, mixture components, and categorical factors: Mix your cake (with different ingredients) and bake it too!
- Design and analysis of split plots: Make your experiment far easier by grouping hard-to-change process factors and/or mixture components.

“Great for newbies or just to confirm my own independent selection.”
“It helps the novice quickly and wisely build a design to suit their needs.”
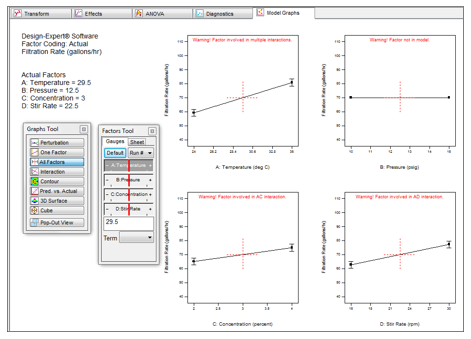
“Excellent! Very useful. Love this! The All Factors profiles plot is definitely is a good option.”

“Excellent! Great addition! It is very important that this is now possible.”
"Love the Autoselect tool!"
“Excellent! AICc is a very useful new feature, it worked better than other software.”
Free 30-day Trial
Give version 10 a try by downloading the free 30-day trial from our web site. See for yourself how powerful and easy-to-use DOE software can be!
Upgrades
If you have an older version of Design-Expert software, purchase an upgrade to v10 and save a considerable amount off the cost of a new license. Purchase an upgrade online or contact info@statease.com for help.
Annual Network Licenses
If you have an annual network license, the end-user in charge of the license should have already received a free upgrade to v10 (as long as your license is current). For help finding it, contact info@statease.com.
Academic Licenses
For academic inquiries, click here.
Free Webinar in April on What's New and Exciting in v10 of Design-Expert® Software
Sign up now for a free webinar on What's New and Exciting in v10 of Design-Expert Software! Pat Whitcomb, Founder of Stat-Ease, Inc., welcomes you to version 10 of Design-Expert software (DX10) for design of experiments (DOE). He hits on the highlights of what’s new and what’s in it for you. For a preview of what’s in store, look here. As a practical matter, the most valuable addition may well be the extension of split-plot design and analysis to response surface and combined designs. Pat provides an enlightening demonstration of this and many other cool new features that provide convincing evidence of why version 10 is a significant step forward from version 9. This webinar will be recorded and posted to our web site after the 25th so that those of you who can't attend the live presentation can watch it at your convenience.
Monday, April 25th at 11:00 am - 12:00 pm CDT*
*To find out what time the meeting is in your city, click here for a link to The World Clock Meeting Planner.
Register Now for the 6th European DOE User Meeting & Workshop May 18-20, 2016 in Leuven, Belgium!

The Grand Béguinage of Leuven
Stat-Ease, Inc. and CQ Consultancy are pleased to announce the 6th European DOE User Meeting and Workshops on May 18-20, 2016 in Leuven, Belgium. It will be held at the Faculty Club, which is part of the historic Grand Béguinage*. The béguinage originated in the early 13th century and is a UNESCO World Heritage location. This bi-annual event is always a favorite with attendees—both informative and fun! Besides the interesting presentations and learning opportunities, this year's event in Leuven will give you an opportunity to check out the music, architecture and beer that Belgium is famous for!
At the DOE user meeting on the 19th–20th, we will explore the latest design of experiments (DOE) techniques, and demonstrate great new features in just-released Design-Expert® software, version 10! There will be presentations by keynote speakers and DOE experts, as well as practical case study applications by actual Design-Expert software users. In addition, you will have the opportunity to get help from DOE consultants on your own particular applications.
Our expert trainers are offering two pre-meeting workshops on May 18th:
1. Figuring Out Factorials by CQ Consultancy
2. Optimal Formulation and Processing of Mixtures via Combined Designs by Stat-Ease, Inc. (Prerequisite: Familiarity with factorials.)
Sign up for one of these two workshops and learn practical DOE skills that you can take home and apply.
Special Event the First Night of the Meeting
On the evening on the 19th, there will be a special event for all attendees. We'll start out with a concert by the choral group, Currende. Directed by Erik Van Nevel, Currende specializes in 16th and 17th music and the great works of Bach and Mozart. Listen to a sample of their beautiful music at the above link.
After the concert we will head out for the conference dinner and ultimate beer experience at The Capital. In the backyard of the largest beer producer in the world, The Capital offers the largest beer selection in the world. This is an event you won't want to miss!
Dates & Location
18 – 20 May 2016: DOE User Meeting (Includes dinner and special event on the 19th) and Pre-Meeting Workshops
Faculty Club
Groot Begijnhof 14,
3000 LEUVEN
Belgium
T. +32 (0) 16 32 95 00
F. +32 (0) 16 32 95 02
For more information and to register for the 6th European DOE User Meeting and Workshops click here. We hope to see you in Leuven!
*According to the UNESCO World Heritage Convention, "Béguines were women who dedicated their lives to God without retiring from the world. In the 13th century they founded the béguinages , enclosed communities designed to meet their spiritual and material needs. The Flemish béguinages are architectural ensembles composed of houses, churches, ancillary buildings and green spaces, with a layout of either urban or rural origin and built in styles specific to the Flemish cultural region. They are a fascinating reminder of the tradition of the Béguines that developed in north-western Europe in the Middle Ages." [http://whc.unesco.org/en/list/855]
Get Up to Speed on DOE with Our Instructor-Led Workshops
Whether you are just starting out or are a practiced experimenter, Stat-Ease has a workshop for you. Find a list of our upcoming public workshops below. We also offer a large variety of private on-site workshops, including industry-specific classes. This is a cost-effective and convenient option if you have 5 or more people to train. For more information on private workshops, click here.
Experiment Design Made Easy (EDME)
May 3-4: Minneapolis, MN
Jun 20-21: San Jose, CA
Aug 8-9: Edison, NJ
Sep 20-21: Minneapolis, MN
Nov 7-8: San Jose, CA
$1295 ($1095 each, 2 or more)
Response Surface Methods for Process Optimization (RSM)
Jun 22-23: San Jose, CA
Sep 22-23: Minneapolis, MN
$1295 ($1095 each, 2 or more)
Mixture and Combined Designs for Optimal Formulations (MIXC)
Jul 19-21: Minneapolis, MN
Oct 17-19: Edison, NJ
$1695 ($1495 each, 2 or more)
Workshops are limited to 16. Receive a $200 quantity discount per class when you enroll 2 or more students, or when a single student enrolls in consecutive 2-day workshops. For more information, contact Rachel via e-mail or at at 612.746.2030.
Complete Your DOE Package with Stat-Ease Consulting Services

Back row from left to right: Brooks Henderson, Mark Anderson, Wayne Adams
Front row from left to right: Pat Whitcomb, Shari Kraber, Martin Bezener
Stat-Ease's consulting team recently expanded with the hiring of Martin Bezener, a PhD graduate in Statistics from the University of Minnesota. He makes a great addition to our well-qualified team of design of experiment (DOE) experts. We are pleased to offer our consulting services to support all your experimentation needs. We provide mentoring/coaching to help you set up the right design for the problem, and then guide you through the proper analysis of your data. Our consulting services can be geared to either teach you how to do DOE effectively on your own, or we can be the experts in your back pocket! Services may be purchased for as little as an hour of time, or you can contract us for an entire project. Our standard rate is $275/hour, with a 20% discount available when purchasing consulting (up to 10 hours) bundled together with software or training. We also offer generous academic discounts.
Our complete package of design of experiment (DOE) services for all your experimentation needs includes:
- World-class software – Design-Expert v10 now available!
- Live, in-person training at locations across the country
- The Stat-Ease Academy for e-learning at your convenience
- Consulting services for DOE projects.
If you have any questions about our services, contact stathelp@statease.com for help. Leverage our expertise to make your experimentation a success!
Practical Aspects for Designing Statistically Optimal Experiments
(Editor’s note: This is an outtake of an article by Mark Anderson and Pat Whitcomb that was published in the Journal of Statistical Science, Vol. 2, No. 3, March 2014.)
Due to operational or physical considerations, standard factorial and response surface method (RSM) design of experiments (DOE) often prove to be unsuitable. In such cases a computer-generated statistically-optimal design fills the breech. This article explores vital mathematical properties for evaluating alternative designs with a focus on what is really important for industrial experimenters.
Statistically optimal designs emerged over a half century ago (Kiefer, 1959) to provide the following advantages over classical templates for factorials and RSM:
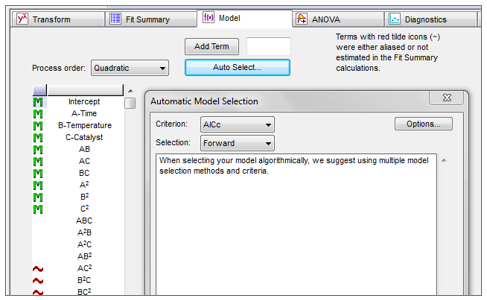
- Efficiently filling out an irregularly shaped experimental region such as that shown in Figure 1 (Anderson and Whitcomb, 2005),
- Minimizing the runs to just what is needed to fit the assumed polynomial model,
- Accommodating unusual requirements concerning either the number of blocks or the number of runs per block,
- Handling a combination of factor types, such as continuous, discrete, categorical and mixture.
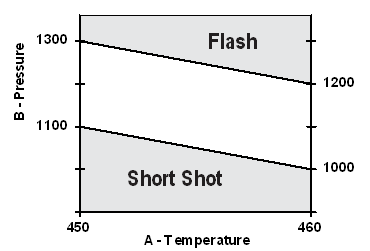
Figure 1: Example of irregularly-shaped experimental region (a molding process)
Over time a number of criteria labeled alphabetically became favored by industrial experiments for optimal designs (Box and Draper, 2007), of which two will be covered in this article: I-optimal and D-optimal. Our focus will be kept to RSM.
What is a “Good” Experiment Design?
To answer this important question, let’s start with a wish-list for choosing a “suitable” experiment design derived from one provided by George Box (Box, 1982)—the co-inventor of RSM (Box and Wilson, 1951):
- Allow the chosen polynomial to be estimated well.
- Give sufficient information to allow a test for lack of fit by:
a. Having more unique design points than model coefficients, and
b. Providing an estimate of “pure” error, i.e., replicates. - Remain insensitive to outliers, influential values and bias from model misspecification.
- Be robust to errors in control of the factor levels.
- Permit blocking and sequential experimentation.
- Provide a check on variance assumptions, e.g., studentized residuals are normal with a mean of zero and constant variance.
- Generate useful information throughout the region of interest, i.e., provide a good distribution of standard error of predictions.
- Do not contain an excessively large number of trials.
When applying RSM, industrial experimenters generally choose as step one a quadratic polynomial, which are remarkably versatile for empirical modeling. For this purpose, the central composite design (CCD), also known as the Box-Wilson in honor of the developers, scores well on all the desired attributes. However, standard layouts like the CCD are not a good fit for non-cuboidal regions such as that illustrated in Figure 1. For situations like this or others spelled out in the Introduction, optimal designs are seemingly the panacea. However, as we will discuss further, you had best keep in mind that “designing an experiment should involve balancing multiple objectives, not just focusing on a single characteristic” (Myers, Montgomery and Anderson-Cook, 2009).
Purely Optimal Designs—Comparing I Versus D as the Criterion
Although there are many variations on the theme of optimal design, the following two criteria are the ones primarily used in industrial experimentation:
- I-optimal (also known as “IV”) to minimize the integral of the prediction variance
- D-optimal to minimize the volume of the confidence ellipsoid for the coefficients and thus maximize information on the polynomial coefficients.
Rather than getting mired down in the mathematical details for these two criteria and the multitude of algorithms for applying them (readily available from a vast array of references—some already cited here), we will focus on how they differ in actual application to RSM experiments designed to fit quadratic polynomials such as the equation show above. For this purpose a good tool for comparison is the standard error (SE) plot, such as those shown in Figure 2 for a 12-run RSM design on one factor where the points are picked I- versus D-optimally.
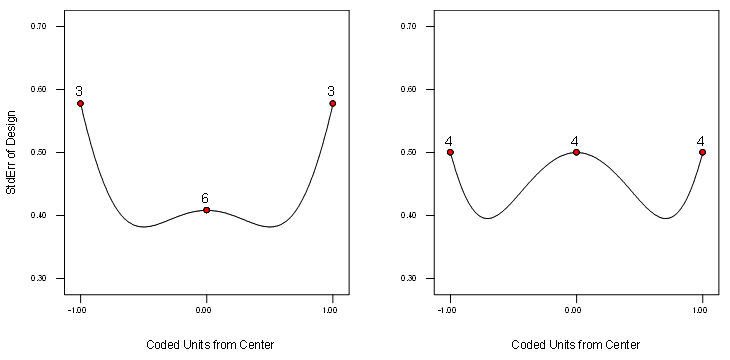
Figure 2: Standard error plots for I (left) versus D optimal (right) for a 12-run, one-factor RSM design
Comparing these plots side-by-side provides a picture of the relative quality of predicted response at various locations spanning the experimental region (shown here in terms of coded units from the center). The greater replication of points by the I-criterion is desirable for RSM because it lowers the standard error of prediction at the center—the point of greatest interest—and provides a fairly flat profile for a broader (relative to the D-criterion) range in the middle of the experimental region.
Another way to compare designs is via the fraction of design space (FDS) plot (Anderson-Cook, Borror and Montgomery, 2009), which consists of a single line for a given design, thus allowing display of the prediction variance for several designs at once. Figure 3 lays out the FDS curves for the aforementioned 12-run RSM design done by the competing criterion—I versus D.
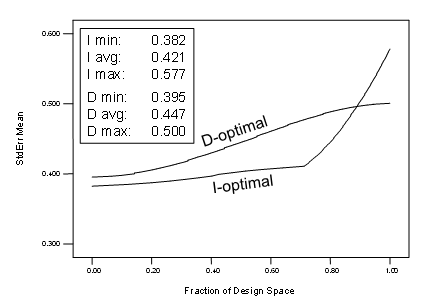
Figure 3: FDS plots for I versus D optimal for a 12-run, one-factor RSM design
The legend in Figure 3 provides benchmarks on the standard error minimums, averages and maximums. For RSM purposes, the I-optimal provides a desirable tradeoff of being higher at its maximum (not good) but lower on average (good) than the D-optimal design.
At this stage we put I-optimal at the forefront. However, neither of the two optimal designs under consideration provide for a lack-of-fit (LOF) test. Therefore an experimenter cannot assess whether the model they chose provides an adequate approximation of the true response. It’s vital to keep in mind that “no postulated model can ever be assumed to be fully correct [therefore] the basic assumptions underlying the alphabetic-optimality approach are often unrealistic from the practical viewpoint of actually designing real experiments” (Draper & Guttman, 1988).
Modifying Optimal Designs to Make Them More Robust to Model Misspecification
We will now do another comparison of point selection using I- vs D-optimal on a one-factor design for a quadratic model, but this time the designs will be modified with LOF points to check for model misspecification. We recommend 4 runs for these ‘check-points’—chosen to maximize the minimum distance from existing design points; thus filling ‘holes’ in the experimental space. This is known as the “distance” criterion. Figure 4 provides a side-by-side view, by way of standard error plots, of how this modification affects the spread of points compared to the purely optimal selection shown in Figure 2.
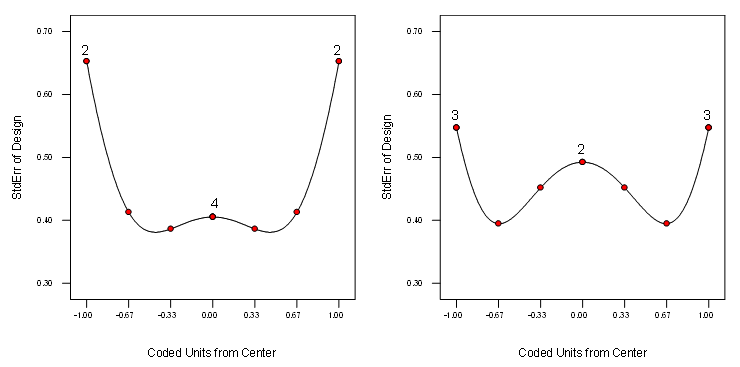
Figure 4: SE plots for LOF-modified I-optimal (left) versus LOF-modified D-optimal (right) for a 12-run, one-factor RSM design
Observe how gaps in the experimental range have been plugged.
Next let’s recalculate the FDS for the two alternative optimal criteria.
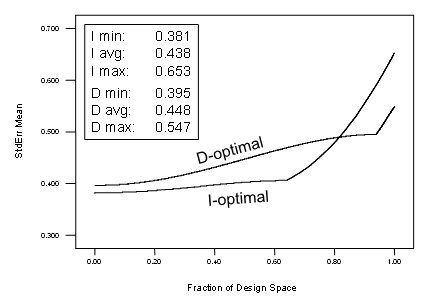
Figure 5: FDS plots for LOF-modified I versus D optimal for a 12-run, one-factor RSM design
Compare and contrast the curves and data on Figures 3 and 5—the first being purely optimal and the second modified with lack-of-fit points. Notice that by all statistical measures and the curves themselves that not much differs. In this case the advantage of having a check for model misspecification outweighs the minor loss in optimality and slight degradation in FDS quality.
Extending These Findings to Two Factors
A similar case can be made for two factors and, by extension, beyond—once the minimum points needed to fit the chosen polynomial model are selected via an optimal criterion, adding LOF points causes little harm and they create a lot of good. Figure 6 lays out the points on SE plot for a 14-run, I-optimal, RSM-quadratic design with zero versus four LOF points.
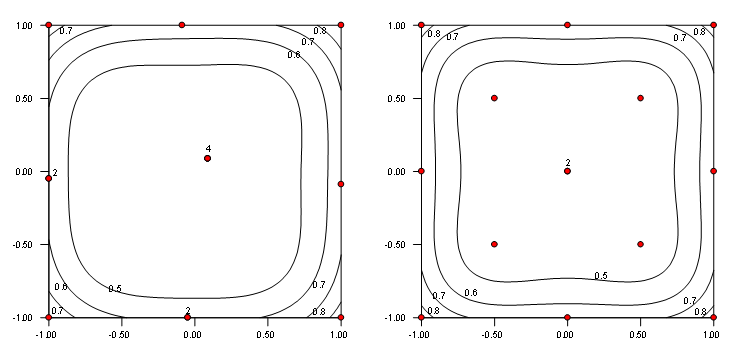
Figure 6: SE plots for purely I-optimal (left) versus LOF-modified (right) for a 14-run, two-factor RSM design
The space-filling effect of shifting some points from optimal to distance-based criterion (for LOF) is very apparent when comparing these plots from left to right. This comes at little cost to the I-optimal design quality as evidenced by the FDS curve and properties laid out in Figure 7.
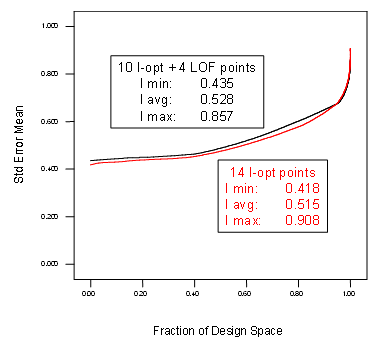
Figure 7: FDS plots for purely I-optimal versus LOF-modified I-optimal for a 14-run, two-factor RSM design
However, when we make the same comparison for D-optimal designs, the trade-off of 4 purely optimal points for ones chosen by distance (layouts shown in Figure 8) to provide LOF does not go quite as well—see how the FDS curve shifts in Figure 9 and note the degradation in D-optimality as evidenced by the determinant results being increased.
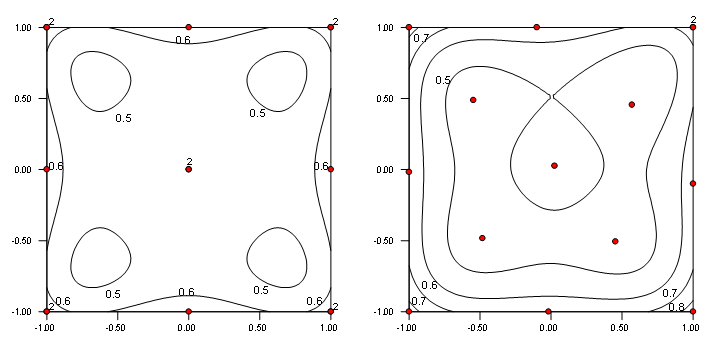
Figure 8: SE plots for purely D-optimal (left) versus LOF-modified D-optimal (right) for a 14-run, two-factor RSM design
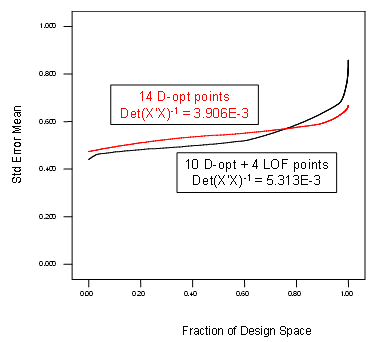
Figure 9: FDS plots for purely D-optimal versus LOF-modified D-optimal for a 14-run, two-factor RSM design
This lends further support for the use of I over D-optimal designs for response surface method optimization.
Bolstering the Design with Replicates
Replicates are needed to provide the pure error needed for a LOF test. In the cases presented above they came with the optimal portion of the designs. A better way to build a practical experiment is to detail the number of replicates and choose them by the optimal criterion—we recommend a minimum of 4 points being selected in this manner. This provides enough degrees of freedom for a reasonably-powerful LOF test.
Conclusion
In consideration of the practical aspects of algorithmic design for RSM we recommend adding by distance-base at least 4 points for testing lack of fit, even though this makes the experiment less alphabetically optimal. This a good trade off. Furthermore, in physical experiments it is desirable to build in an estimate of experimental error based on at least 4 degrees of freedom via replicated design point(s). For choice of optimal criterion we advise using I- for empirical modeling (RSM)—reserving D-optimal (because of their more-precise estimation of model coefficients) for factorial screening.
However, even with these practical aspects incorporated, optimal design cannot make up for:
- Choosing the factors that are not among the vital few.
- Designing for an inadequate empirical model.
- Going out of the region of operability.
- Measuring the wrong responses.
“The exact functional relationship is usually unknown and possibly unknowable. We have only to think of the flight of a bird, the fall of a leaf, or the flow of water through a valve to realize that we are likely to be able to approximate only the main features of such a relationship.”
– Box & Draper
References
Anderson, M. J. and Whitcomb, P.J. (2007) RSM Simplified, Optimizing Processes Using Response Surface Methods for Designs of Experiments, Computer-Generated Optimal Designs,” 7: 149-150, New York: Productivity Press.
Anderson-Cook, C.M., Borror, C. M. and Montgomery, D. C. (2009) “Response surface design evaluation and comparison,” Journal of Statistical Planning and Inference, 139: 629–641.
Box, G. E. P., and Wilson, K B. (1951) “On the experimental attainment of optimum conditions,” Journal of the Royal Statistical Society, Series B 13:1-45.
Box, G. E. P. (1982) “Choice of Response Surface Design and Alphabetic Optimality,” Utilitas Mathematica, 21B: 11-55.
Box, G. E. P., and Draper, N. R. (2007) Response Surfaces, Mixtures, and Ridge Analyses, “The Alphabetic Optimality Approach,” 14.4: 471-481, New York: Wiley.
Draper, N. R. and Guttman, I. (1988) “Rationalization of the “Alphabetic-Optimal” and “Variance Plus Bias” Approaches to Experimental Design,” Technical Report 841, Department of Statistics, University of Wisconsin.
Kiefer, J. (1959). “Optimum Experimental Designs,” Journal of the Royal Statistical Society, Series B 21: 272–319.
Myers, R. H., Montgomery, D. C. and Anderson-Cook, C.M. (2009) Response Surface Methodology, 3rd Edition, New York: Wiley.
—Mark Anderson, mark@statease.com