Stat-Teaser September 2015

In this issue:
1. 8 Tips for DOE Success by Shari Kraber
2. How to Resolve Partial Aliasing by Wayne Adams
3. CAMO Software and Stat-Ease, Inc. Release Strategic Software Platform
4. SAVE THE DATE for the 6th European DOE User Meeting & Workshop May 2016 in Leuven, Belgium!
5. Announcing the Stat-Ease Academy for e-Learning
6. Instructor-Led Workshop Schedule
8 Tips for DOE Success

Stat-Ease Consultant Group. Back row from left to right: Brooks Henderson,
Mark Anderson, Wayne Adams. Front row from left to right: Pat Whitcomb,
Shari Kraber, Martin Bezener
For those new to design of experiments (DOE) it can be hard to know where to begin. To help experimenters get off to a great start, I asked our team of consultants what advice they would give them. After sifting through their answers and combining those that were similar, I condensed the list down to the top 8 and ranked them according to the consensus of our statistics group. Hopefully you will find these tips useful and they will lead you to DOE success!
- Take time to plan your experiment, carefully spelling out the objective, the response(s) to be measured, the factors to be studied, and the design that fits the best. Consider your strategy of experimentation at this stage: screening, characterization or optimization (SCO—see this enlightening post by Ron Snee on this tried-and-true approach for good DOE). Time spent planning up front will pay off with fewer problems in the data analysis later.
- Apply DOE to gain process understanding, not just to pick the best combination of factor settings. When you have to put out that next fire, a profound knowledge of your process will save you a lot of wasted effort looking in all the wrong places!
- Screening designs depend on the sparsity of effects principle—i.e. only a vital few factors will likely merit in-depth study. If you are experimenting with factors that are all likely to interact, then use a resolution V or higher design, not a screening design.
- Small designs, 8 runs or less, will only find big effects. This may result in no factors being shown as statistically significant, even though they really are important. This is a problem of power. Learn about estimating the power of a design here.
- Statistical analysis will be moot if you do not have an accurate and discriminating measurement system. Before doing a DOE, invest in developing a good method for collecting your data.
- When experimenting with formulations, you likely will get the best results with a mixture design. If your response is a function of the proportions of the ingredients (including water!), then use a mixture design. For more on the reasons why, see our primer on mixture design .
- There is no cookie-cutter design that will fit all problems. Learn about DOE tools and choose the one that best fits your situation. Optimal (custom) designs may be a better fit than textbook designs, so don’t be afraid to use them! See, for example, the Optimal Numeric tutorial.
- Real-world problems often require restrictions on randomization. If you are sorting the DOE runs to make it easier to conduct your experiments, this is a split-plot design! In this case, the regular ANOVA analysis may over-estimate some effects and under-estimate others. For more details on split plots, go to http://www.statease.com/training/webinar.htmland see these two webinars:
- “ I Really Would Rather Not Randomize My Experiment!!!” by Wayne Adams
- “Split-Plot Pros and Cons” by Pat Whitcomb.
For more tips on how to get a jump start on doing DOE, enroll in the new 4 Easy Steps to Effective Factorial Design e-learning course presented by the Stat-Ease Academy. This free online course is available here.
—Shari Kraber, shari@statease.com
↑Go back to the top
How to Resolve Partial Aliasing
In this follow-up to his March 2015 article on “Understanding Aliasing of Fractional Factorial Design,” Stat-Ease Consultant Wayne Adams explains partial aliasing. He then illustrates the adverse effects and how to repair them via an industrial case study.
A good example of a design with partial aliasing is the popular 12-run Plackett-Burman (P-B). The confounding of main effects, e.g., the factor J shown in Table 1, in this resolution III design is intimidating. (Why this factor is picked and the interactions AB and AD are highlighted will become clear later.)
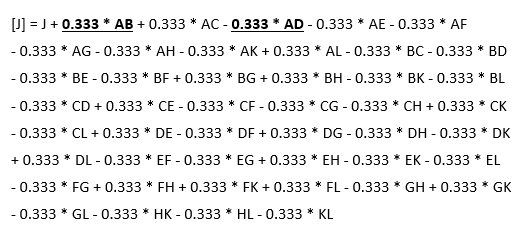
Table 1: Plackett-Burman alias structure for the main effect of factor J
This P-B partially aliases all main effects with every two-factor interaction (2FI) not containing that factor. Thus, all main effect (ME) and interaction estimates are biased by each other. In the worst case, the aliased effects will cancel, e.g. A's coefficient being truly +1 and the coefficient for BC coming in at +3, in which case it calculates out at zero ([A] = 1*A - ⅓*BC = 1*1 - ⅓*3 = 0). Fortunately, this perfect storm is a rare event. More commonly, only a few interactions are active and their coefficients can add up to produce a false main effect. Some DOE experts refer to this as 2FIs being “smeared out” over a number of MEs. No matter how you look at it, results such as this will not further the quest for profound knowledge of your system.
These deficiencies in P-Bs are well documented. Plackett and Burman, the inventors of the design, developed it “… assuming a simplified linear hypothesis.” Unfortunately, some experimenters remain unaware of this assumption, and they attempt to use these designs in systems that are likely to be driven in part by interactions of factors. That is why we recommend higher resolution IV designs as a general rule for initial screening experiments.
To illustrate a common problem with the analysis of a P-B design, let’s go through an example borrowed from our Experiment Design Made Easy class. In this case, a team of metallurgists want to quantify the effects of 11 factors on the tensile strength of the welds. They go with the minimum 12-run design laid out in Table 2 (listed in random order).
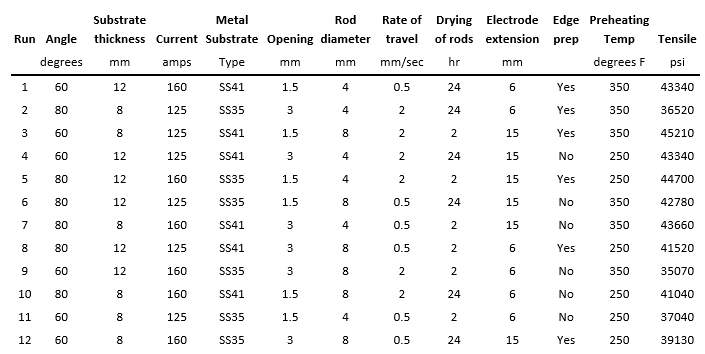
Table 2: Plackett-Burman design for welding experiment
Figure 1 illustrates a number of the factors.
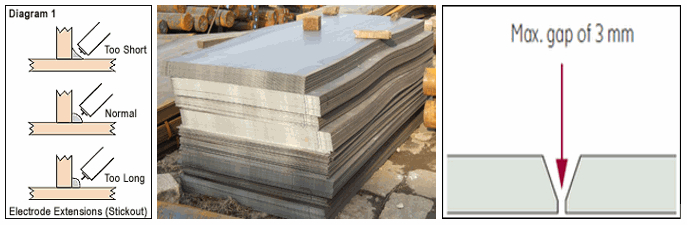
Figure 1: Pictorial examples of selected factors
The effects on tensile strength can be seen in the half-normal graph (Figure 2), positive ones in orange and negatives in blue. Electrode extension (J) and metal substrate (D) stand out as positive effects: high settings on these two factors, 15mm and SS41; respectively, increase the tensile strength. Next comes a negative effect for the opening (E), which indicates that the low setting (1.5mm) will be best.
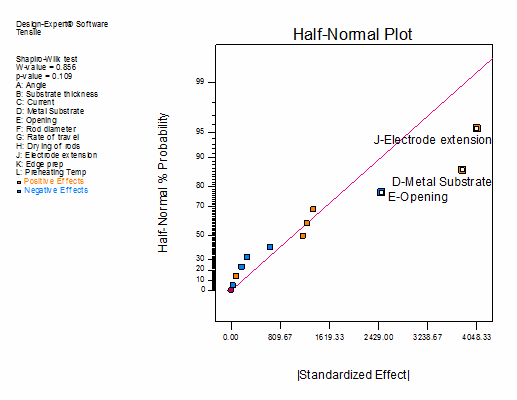
Figure 2: Half-normal plot for welding results
When these settings are used the tensile strength of the welds is indeed improved. However, with all the aliasing, it remains unclear whether it’s really these main effects that make the difference or two-factor interactions of other factors.
A common way to get out of this alias jam is to add more runs via “foldover” on the factor settings. This design augmentation exchanges the low factor levels for the highs and the highs for the lows, that is, it flips the design over to the opposites. These “folded” runs form a second block in the augmented design. Normally the foldover is re-randomized. However, to show the structure, Table 3 is laid out along the same lines as the first block of runs in Table 2.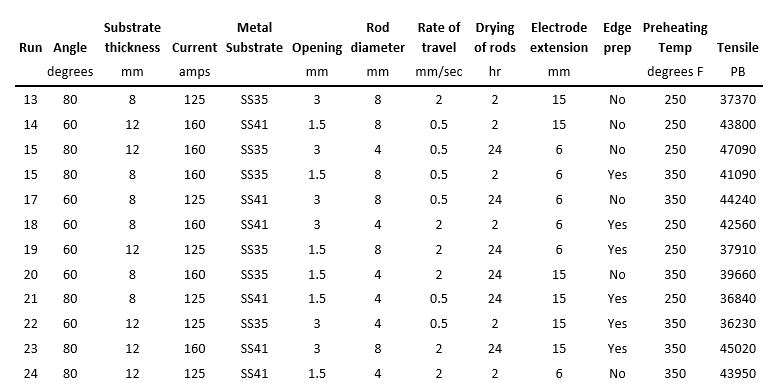
Table 3: Exact Foldover of the original 12 runs; the second block
When the two blocks of data are combined, the alias structure improves. The main effects are no longer aliased with the 2FIs. The 2FIs, however, remain aliased with other 2FIs, i.e., resolution IV. This is illustrated in Table 4 by the aliasing for the effects AB and AD. (Why these particular interactions are picked will soon become apparent.)
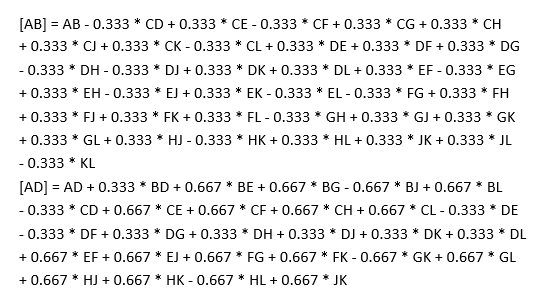
Table 4: Alias Structure for the AB and AD interactions
With all 24 runs the half-normal plot reveals more of the truth as you can see in Figure 3.
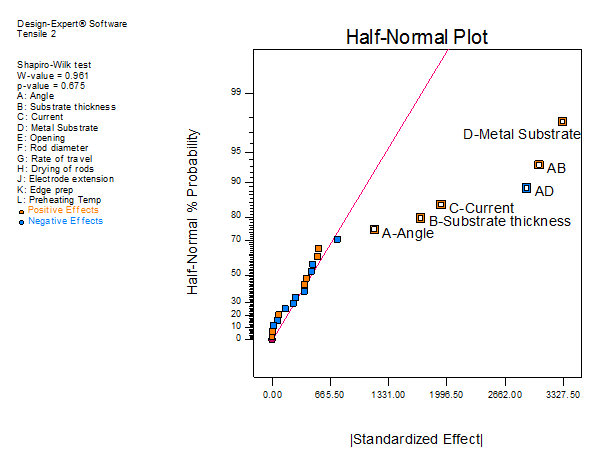
Figure 3: Half-normal plot for the foldover design
The metal substrate effect (D) was indeed true. Other than that, the whole picture of what’s really affecting the weld strength has been turned upside down. The main effects of J and E have disappeared and interactions AB and AD have emerged, as well as the main effects A, B and C. Looking back at Table 1 you can see how the initial design fooled the experimenters into thinking factor J was the heaviest hitter when it really was the AB and AD 2FI’s—their effects being partially aliased with this main effect.
The newly revealed main effects from angle (A), substrate thickness (B) and current (C) weren't revealed by the initial block of runs due to a combination of alias cancellation and inadequate power. By doing the foldover the experimenters gained two advantages: improved resolution and increased power.
Due to the aliasing shown in Table 4, the metallurgist still could not be certain that the interactions were AB and AD. However, it turns out that interactions most often stem from factors with significant main effects. Statisticians refer to this as “effect heredity.” This seemed very sensible to the metallurgists.
In conclusion, the foldover fixed the main-effects aliasing issue in the initial P-B design, and it provided enough power to reveal some smaller, but important, effects. The foldover upgraded the design into a true screening design, i.e., resolution IV. Decisions could then be made based on the identified main effects. Furthermore, the factors with insignificant main effects could be dropped from follow-up experiments.
“Assuming” there are no interactions is not the same thing as an “absence” of interactions. When resolution III designs such as Plackett-Burmans are used to gather experiment data, the analysis results depend on the size of the interactions. If you find yourself required to use a Plackett-Burman or other resolution III design, or are following up on published work based on such a design, consider the fold-over method discussed above as the next step in understanding the process.
—Wayne Adams, wayne@statease.com
↑Go back to the top
CAMO Software and Stat-Ease, Inc. Release Strategic Software Platform
![]()

CAMO Software, leaders in multivariate data analysis software, and Stat-Ease, Inc. have released a software bundle for multivariate data analysis and design of experiments. The software bundle combines CAMO’s leading software for multivariate data analysis, The Unscrambler® X, and Stat-Ease’s leading software for design of experiments, Design-Expert®.
The Unscrambler X offers advanced multivariate methods, data visualization tools and the ability to cut through large data sets. It is used in the pharmaceutical, food & beverage, chemical, energy, mining & metals, paper and agriculture sectors.
Design-Expert enables users to make breakthrough improvements to a product or a process. One can not only screen for vital factors, but also locate ideal process settings for top performance and discover optimal product formulations.
Together, the product bundle will provide customers with access to two world-class software packages providing advanced data analysis in one solution.
Shirley A. Henshall, CEO of CAMO Software, says: “We are pleased to announce the launch of this product bundle together with Stat-Ease. It will provide our customers with leading tools for DOE as well as the existing multivariate data analysis features our customers have enjoyed for many years.”
Pat Whitcomb, President of Stat-Ease, Inc. adds, "This product bundle combines two of the best applications for MVA and DOE to provide clients with powerful tools to improve their products and processes."
Read more about the product bundle at www.camo.com. Special pricing is available for a limited time for Stat-Ease customers who wish to purchase the Unscrambler/Design-Expert software bundle. For more information, contact Heidi.
SAVE THE DATE for the 6th European DOE User Meeting & Workshop May 2016 in Leuven, Belgium!

The Grand Béguinage of Leuven
Stat-Ease, Inc. and CQ Consultancy are pleased to announce the 6th European DOE User Meeting and Workshops on May 18-20, 2016 in Leuven, Belgium. It will be held at the Faculty Club, which is part of the historic Grand Béguinage*. The béguinage originated in the early 13th century and is a UNESCO World Heritage location.
On the first day of the event there will be two workshop tracks offered. Then on days two and three, a user meeting will be held with presentations by keynote speakers, as well as case study presentations by DOE practitioners. This is your chance to increase your DOE know-how, network with others, and do some sightseeing in beautiful Leuven.
There is a block of rooms held at the associated Begijnhof Congreshotel at the rate of €165 for a single room and €185 for a double. If you are planning to attend, book now. For more information, contact Kristine Ooms of CQ Consultancy.
These meetings are always very informative and fun! We hope to see you next May. Look for further details in future announcements.
Dates & Location
May 18-20, 2016
Faculty Club
Groot Begijnhof 14
3000 Leuven
Belgium
T. 016 32 95 00
info@facultyclub.be
*According to the UNESCO World Heritage Convention, "Béguines were women who dedicated their lives to God without retiring from the world. In the 13th century they founded the béguinages , enclosed communities designed to meet their spiritual and material needs. The Flemish béguinages are architectural ensembles composed of houses, churches, ancillary buildings and green spaces, with a layout of either urban or rural origin and built in styles specific to the Flemish cultural region. They are a fascinating reminder of the tradition of the Béguines that developed in north-western Europe in the Middle Ages." [http://whc.unesco.org/en/list/855]
Announcing the Stat-Ease Academy for e-Learning

Stat-Ease is pleased to announce the launch of the Stat-Ease Academy! Visit the site to access e-learning content on a variety of topics—some free of charge, others available for a small fee. E-learning is the perfect option if you are unable to attend a live workshop or if you are looking for a low-cost way to learn the basics of statistics and design of experiments (DOE)—no traveling necessary! Take advantage of the synergistic interaction for education made possible by the combination of instructor-led and e-learning workshops to create your own blended training program.
Courses currently available include:
1. PreDOE Web-Based Training—an entry-level course for technicians, managers and professional who need to go back to the basics of the fundamental statistics used in DOE.
2. 4 Easy Steps to Effective Factorial Design—learn the four steps used to plan effective DOEs.
3. Finding the Vital Settings via Factorial Analysis—designed as a follow-up to the 4 Easy Steps to Effective Factorial Design e-learning course, you will analyze the DOE looked at previously.
4. DOE SImplified Launchpad—bring the DOE Simplified, 3rd Edition book by Mark Anderson and Pat Whitcomb to life with this narrated presentation of the first three chapters of the book, including hands-on exercises.
Take advantage of this great new resource and register today for an e-learning course! Registration provides you with the online content for 120 days. Learn more here.
Instructor-Led Workshop Schedule
Experiment Design Made Easy (EDME)
Nov 4-5: Oslo, Norway (Click here to register for this workshop)
Nov 9-10: San Jose, CA
Jan 25-26, 2016: San Diego, CA
Mar 7-8, 2016: Edison, NJ
$1295 ($1095 each, 2 or more)
Response Surface Methods for Process Optimization (RSM)
Mar 9-10, 2016: Edison, NJ
$1295 ($1095 each, 2 or more)
Mixture Design for Optimal Formulations (MIX)
Nov 11-12: San Jose, CA
Apr 4-5, 2016: Edison, NJ
$1295 ($1095 each, 2 or more)
Advanced Formulations: Combining Mixture & Process Variables (MIX2)
Apr 6-7, 2016: Edison, NJ
$1495 ($1295 each, 2 or more)
Workshops are limited to 16. Receive a $200 quantity discount per class when you enroll 2 or more students, or when a single student enrolls in consecutive 2-day workshops. For more information, contact Rachel at 612.746.2030 or via e-mail.