Don’t Let R² Fool You
Has a low R² ever disappointed you during the analysis of your experimental results? Is this really the kiss of death? Is all lost? Let’s examine R² as it relates to factorial design of experiments (DOE) and find out.
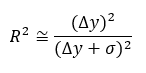
R² measures are calculated on the basis of the change in the response (Δy) relative to the total variation of the response (Δy + σ)over the range of the independent factor:
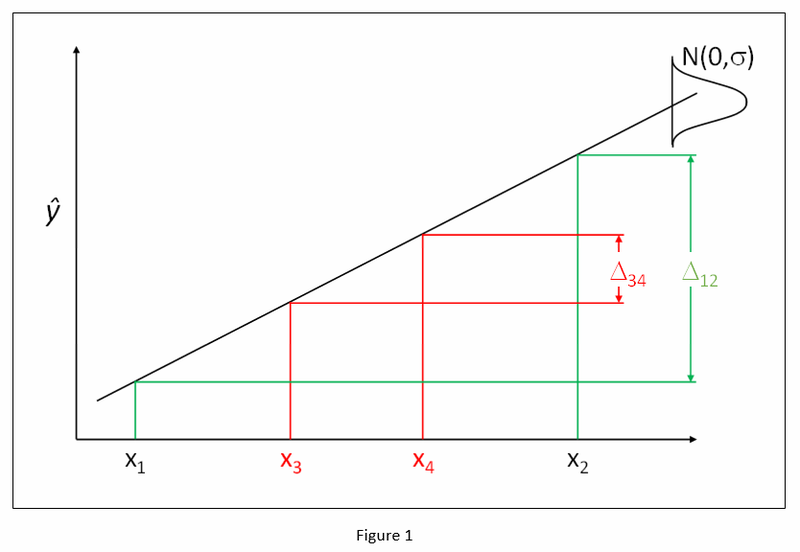
Let’s look at an example. Response y is dependent on factor x in a linear fashion:
We run a DOE using levels x1 and x2 in Figure 1 (below) to estimate beta1 (β1). Having the independent factor levels far apart generates a large signal-to-noise ratio (Δ12) and it is relatively easy to estimate β1. Because the signal (Δy) is large relative to the noise (σ), R² approaches one.
What if we had run a DOE using levels x3 and x4 in figure 1 to estimate β1? Having the independent factor levels closer together generates a smaller signal-to-noise ratio (Δ34) and it is more difficult to estimate β1. We can overcome this difficulty by running more replicates of the experiments. If enough replicates are run, β1 can be estimated with the same precision as in the first DOE using levels x1 and x2. But, because the signal (Δy) is smaller relative to the noise (σ), R² will be smaller, no matter how many replicates are run!
In factorial design of experiments our goal is to identify the active factors and measure their effects. Experiments can be designed with replication so active factors can be found even in the absence of a huge signal-to-noise ratio. Power allows us to determine how many replicates are needed. The delta (Δ) and sigma (Σ) used in the power calculation also give us an estimate of the expected R² (see the formula above). In many real DOEs we intentionally limit a factor’s range to avoid problems. Success is measured with the ANOVA (analysis of variance) and the t-tests on the model coefficients. A significant p-value indicates an active factor and a reasonable estimate of its effects. A significant p-value, along with a low R², may mean a proper job of designing the experiments, rather than a problem!
R² is an interesting statistic, but not of primary importance in factorial DOE. Don’t be fooled by R²!