Christmas Trees on my Effects Plot?
As a Stat-Ease statistical consultant, I am often asked, “What are the green triangles (Christmas trees) on my half-normal plot of effects?”
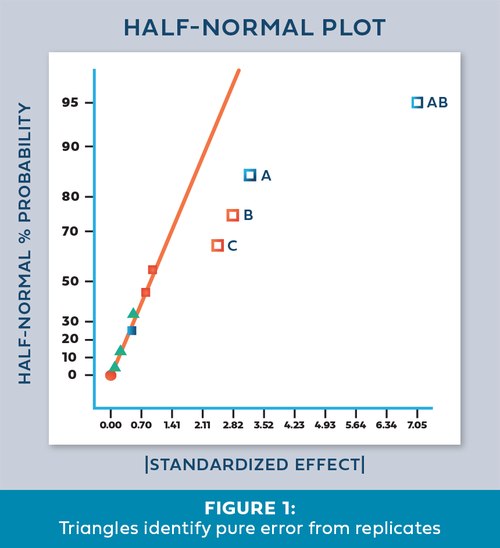
Factorial design analysis utilizes a half-normal probability plot to identify the largest effects to model, leaving the remaining small effects to provide an error estimate. Green triangles appear when you have included replicates in the design, often at the center point. Unlike the orange and blue squares, which are factor effect estimates, the green triangles are noise effect estimates, or “pure error”. The green triangles represent the amount of variation in the replicates, with the number of triangles corresponding to the degrees of freedom (df) from the replicates. For example, five center points would have four df, hence four triangles appear. The triangles are positioned within the factor effects to reflect the relative size of the noise effect. Ideally, the green triangles will land in the lower left corner, near zero. (See Figure 1). In this position, they are combined with the smallest (insignificant) effects and help position the red line. Factor effects that jump off that line to the right are most likely significant. Consider the triangles as an extra piece of information that increases your ability to find significant effects.
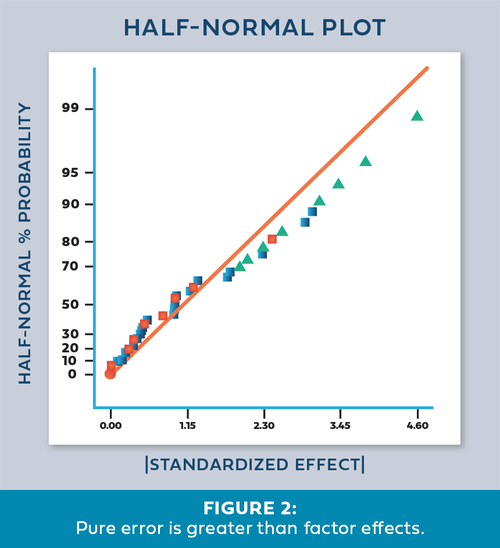
Once in a while we encounter an effects plot that looks like Figure 2. “What does it mean when the green triangles are out of place - on the upper right side instead of the lower left?”
This indicates that the variation between the replicates is greater than the largest factor effects! Since this error is part of the normal process variation, you cannot say that any of the factor effects are statistically significant. At this point you should first check the replicate data to make sure it was both measured and recorded correctly. Then, carefully consider the sources of process variation to determine how the variation could be reduced. For a situation like this, either reduce the noise or increase the factor ranges. This generates larger signals that allow you to discover the significant effects.
- Shari Kraber
For statistical details, read “Use of Replication in Almost Unreplicated Factorials” by Larntz and Whitcomb.
For more frequently asked questions, sign up for Mark’s bi-monthly e-mail, The DOE FAQ Alert.